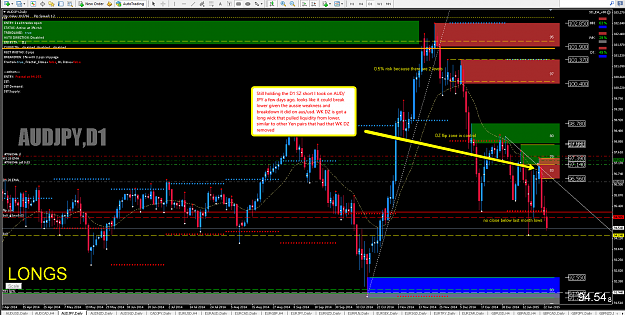
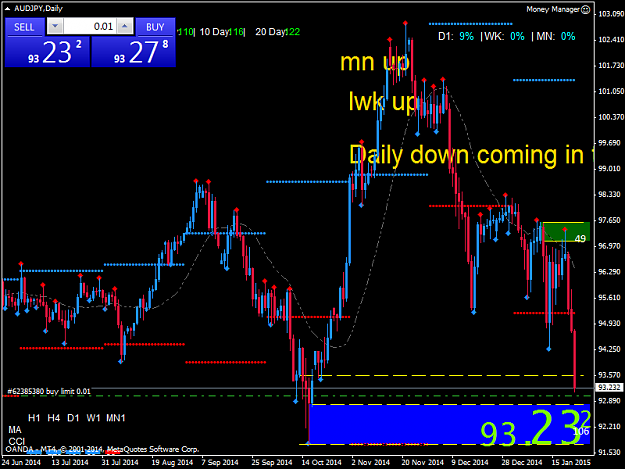
Here is my Top Down analysis for GBPJPY. Advise me on any better thoughts; MONTHLY- 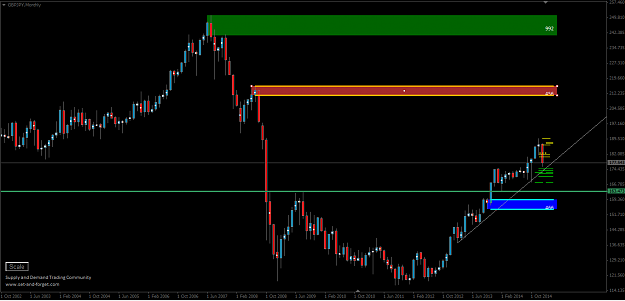
WEEKLY- 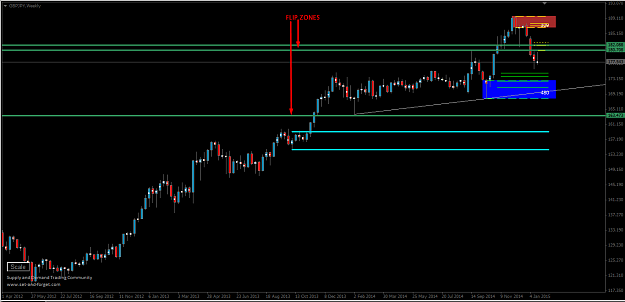
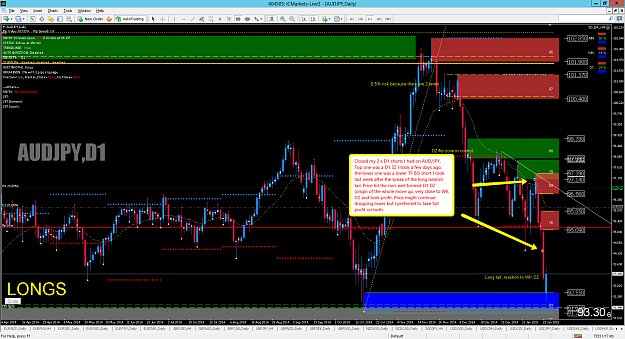
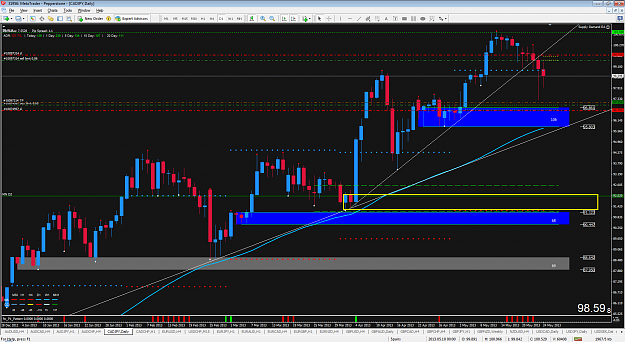
DAILY- 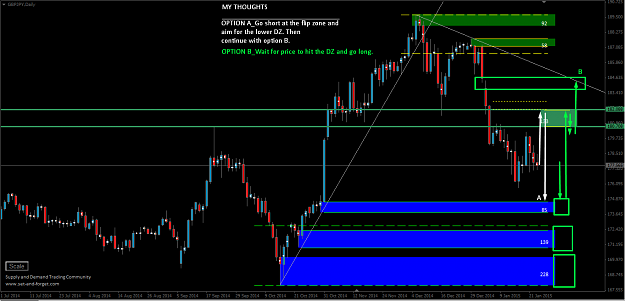
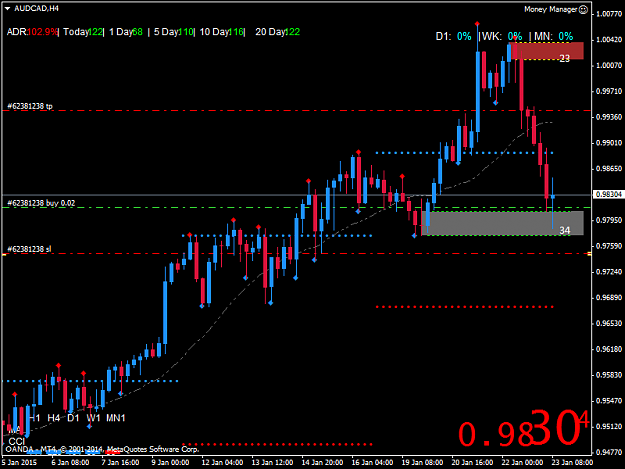
Attached Image (click to enlarge)
Attached Image (click to enlarge)
Attached Image (click to enlarge)
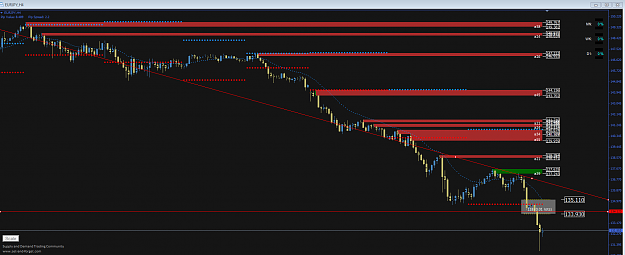
L.L.L.T