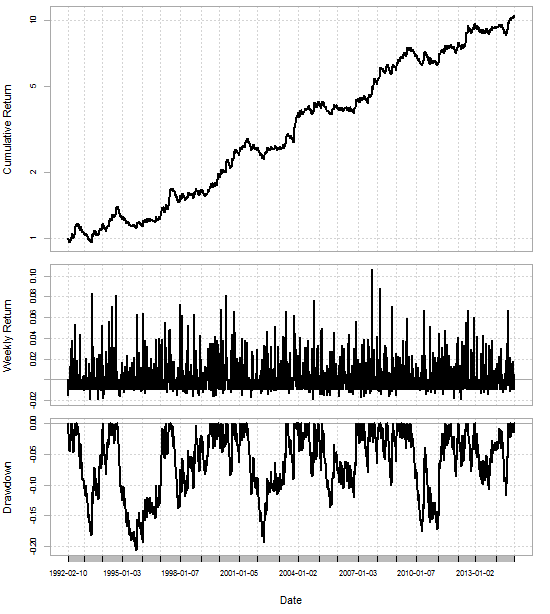
For those of you using the Asirikuy framework you can display your graphs in R instead by using this simple loading script (you need to have the PerformanceAnalytics library installed):
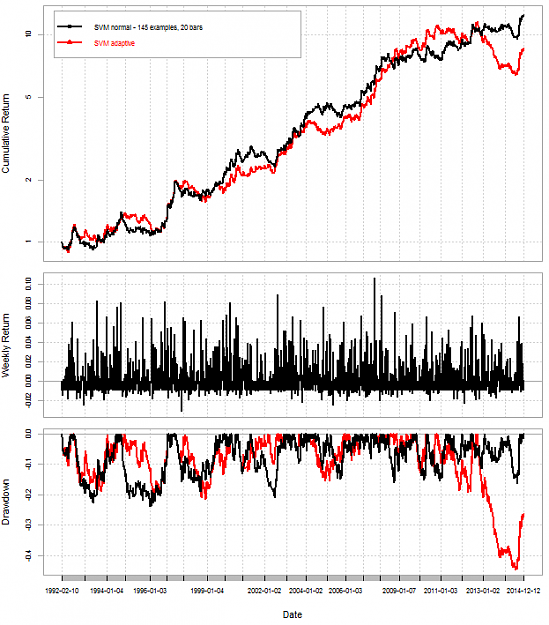
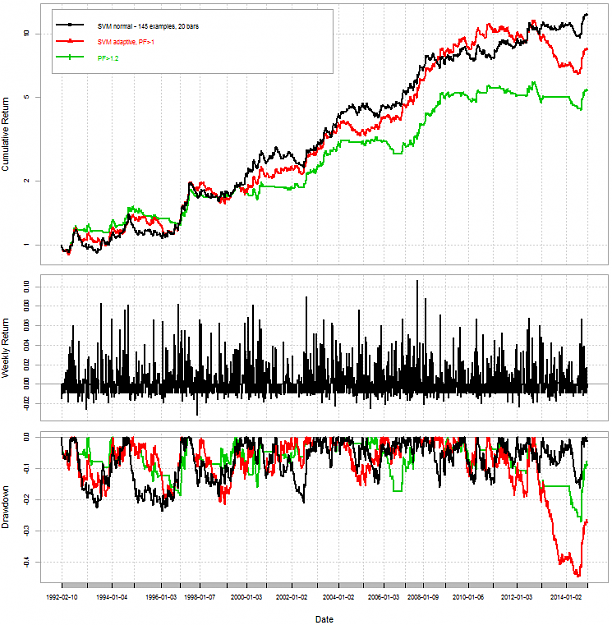
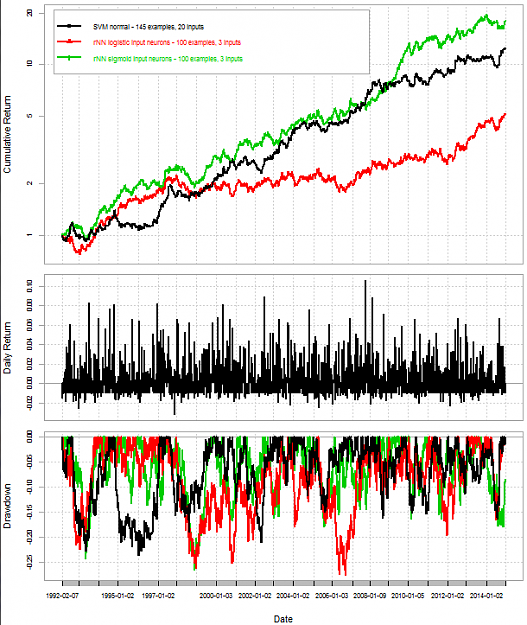
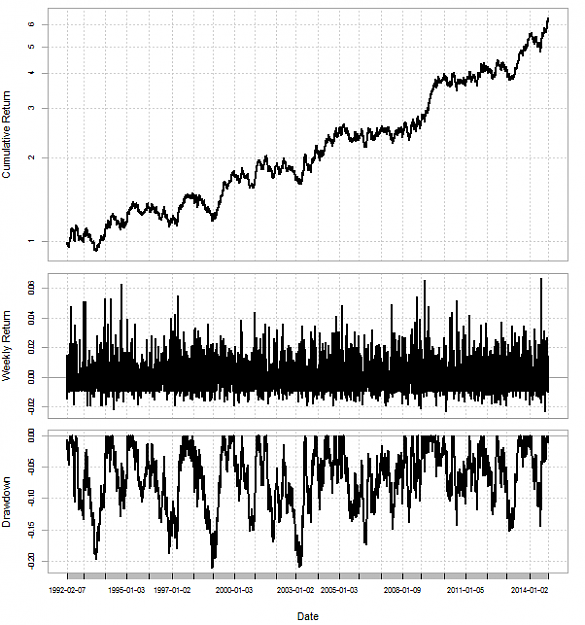
This uses the output txt from the Asirikuy tester and generates graphs like the ones I post on this thread. I find this very useful because the graphs in R have the drawdown and return already there, makes it a hell lot easier to interpret.
Inserted Code
library(PerformanceAnalytics)
temp<- read.zoo("C:/WhereyouHaveYourtest/results.txt", sep = ",",format="%d/%m/%Y %H:%M", header=TRUE,index.column=1,colClasses=c("NULL", "NULL", "NULL", "character", "NULL", "NULL", "NULL", "NULL", "NULL", "NULL", "numeric", "NULL", "NULL", "NULL"))
backtest<- as.xts(temp)
daily <-dailyReturn(backtest)
charts.PerformanceSummary(daily, ylog=TRUE)
This uses the output txt from the Asirikuy tester and generates graphs like the ones I post on this thread. I find this very useful because the graphs in R have the drawdown and return already there, makes it a hell lot easier to interpret.