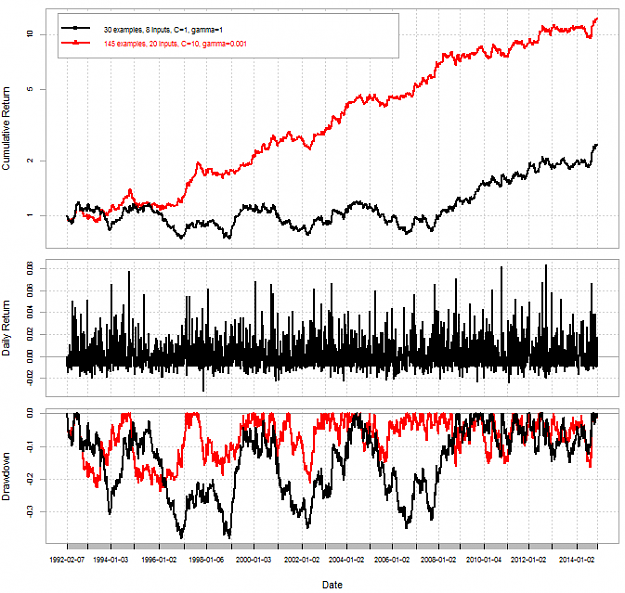
So far when using classifiers to predict returns (1 bullish, 0 bearish) we have only looked at predicting the direction of the next bar's return. However we can also look at attempting to predict the return of the next N bars, making a prediction every day and applying the same rules for trading as we did before. The following are examples using only the past 8 bar directions (1, 0) as inputs and retraining using 30 examples on each bar. The target is the direction of the total return over the next N bars (1 bullish, 0 bearish). These results are on the EURUSD daily chart. I used C=1 and gamma=1 for these runs.
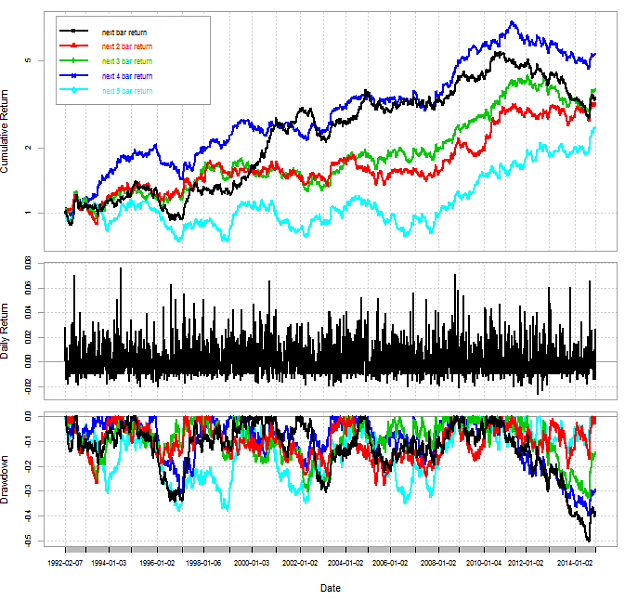
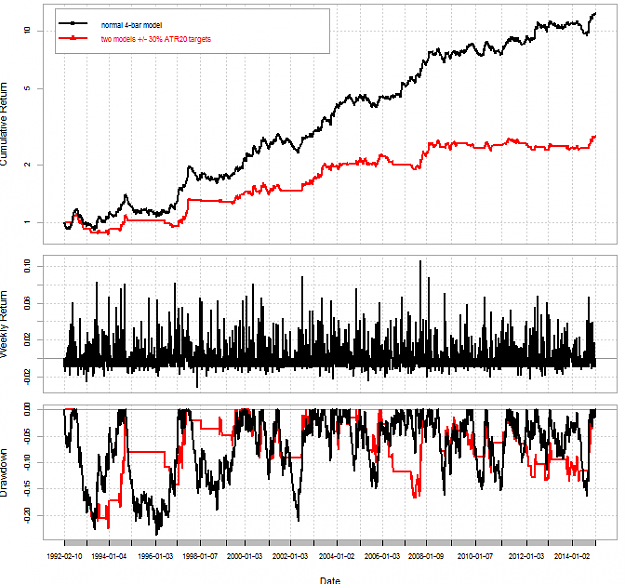
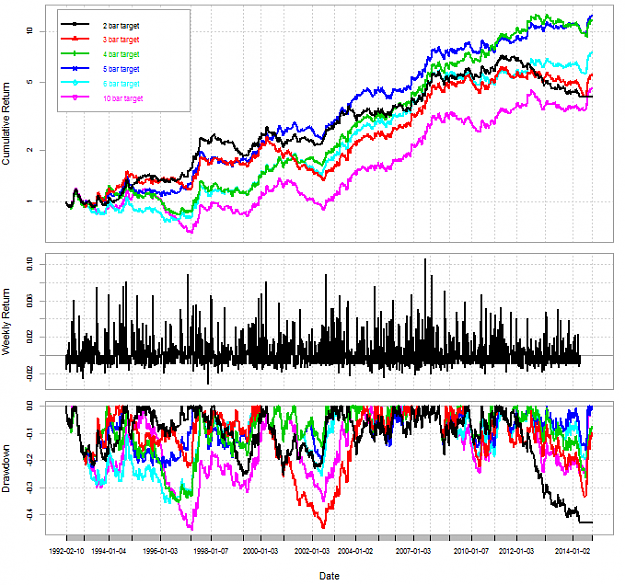
The target has a big impact on the results of the simulation. We can see that when predicting direction for the first 1, 2, 3 and 4 bars we tend to get the bulk of our profit in the 1992-2011 period while for the 5 bar return we tend to get the bulk of positive performance on the 2008-2014 region. We have now found something that makes a quite dramatic difference in returns under recent market conditions. Can we make the 4 day target work for 1992-2000? Could we merge the models somehow to obtain better results? How would you approach this problem?
Attached Image (click to enlarge)
The target has a big impact on the results of the simulation. We can see that when predicting direction for the first 1, 2, 3 and 4 bars we tend to get the bulk of our profit in the 1992-2011 period while for the 5 bar return we tend to get the bulk of positive performance on the 2008-2014 region. We have now found something that makes a quite dramatic difference in returns under recent market conditions. Can we make the 4 day target work for 1992-2000? Could we merge the models somehow to obtain better results? How would you approach this problem?