thank you copernicus for the amount of work you have put in! appreciate your effort very much and look forward to learn more from you.
have a prosperous 2015 everyone!
|
Commercial Member
|
Joined Apr 2013
|4,366 Posts
Factors to Consider in Trend Trading to Improve Expectancy
I am just in the process of undertaking an annual update of trading using this approach and thought for the purposes of this journal and for interested forumites, that I would highlight some of the important considerations that I believe have been critical success factors to this approach to trend trading.
Bias your trend trading criteria to higher timeframes when riding the primary trend and the shorter timeframes when trading the retracement
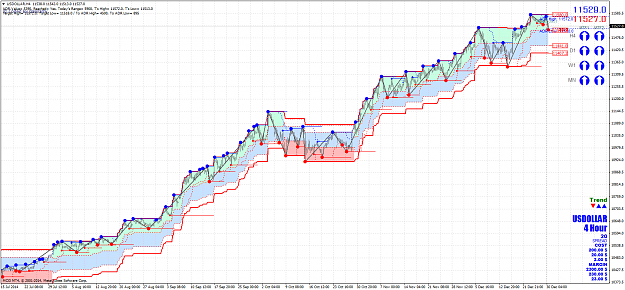
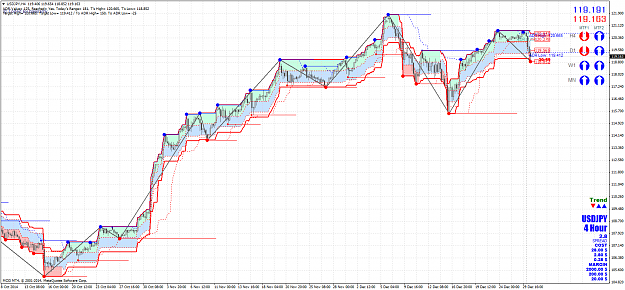
This is not rocket science but I thought I should mention what this means for the approach. The greatest success in this strategy (being a trend trading strategy) has been when the H1 SDC has mirrored the conditions of the SDC on higher timeframes. My personal opinion is that the higher timeframes reflect fundamental criteria as opposed to institutional shenanigans. What this means is that you need to be careful when plotting your SDC on the H1 timeframe and ensure (when trading with the higher timeframe trend) that it's slope and width is consistent with the SDC on the D1, W1 and even M1 timeframes. If you are trading a retracement of the higher timeframe primary trend, the converse is true in that you should trust the H1 SDC and ensure that the commencement of the SDC is based on the lowest low or highest high of the retracement trend.
Ensure you use a trailing stop that is consistent with trend direction and volatility and not a fixed stop when applying this methodology.
The key to trend trading lies in ensuring that price movement is consistent with the trend you are riding. Do not simply set a fixed stop and leave the rest of the trade to pot luck. One of the important factors in trend trading is constant trade management. The whole basis of the decision to trend trade is to ride the trend. Trade management at all points along the way ensures that current price action is consistent with the trend you are following. When price action is no longer consistent with the prevailing trend, it is time for your system to get you out. Note that this is inconsistent with approaches such as the DIBS strategy, Tsunami Strategy and and Equity Millipede approach, however as noted previously this approach seeks to limit drawdowns and maximise income yield.
The SDC is a more faithful guide to reading the trend than conventional trend following techniques.
One of the significant benefits of the SDC, which relates to the point above, is that all price action associated with the trend is captured in its derivation as opposed to say 3 or more highs or lows that influence the derivation of the trend lines used for conventional trend following techniques. The strength of the SDC is that the position of current price within the SDC provides powerful information for the trend follower concerning when a mean retracement is likely, when the trend is running out of steam and most importantly when price action no longer fits the criteria of the trend to provide an optimal exit.
Be prepared to sacrifice profit potential for more consistent yield.
This approach has been configured to provide income yield as opposed to 'shooting for the sky'. For those wishing to adjust the inputs for enhanced returns but also face the requisite increased risk, consider the following adjustments:
Set the H1 SDC to 2.0 on entry and on reaching 3R revert to 1.0 SDC. When reaching 6R revert to 0.5 SDC. This adjustment will allow you to ride trends longer and hopefully launch you into a longer term secular trend of substance. During the initial phases of the trend however more profit will be left on the table on exit but this is the price to pay.
Set the capital risk per trade to 1.0%. Using the current approach the doubling of the trade risk will doube the ROI but also recognise that the max drawdown will also be doubled. Your trade risk per trade using this approach is your major tool to accelerate returns but use it prudently. Your primary goal is to stay in the game. A system with positive expectancy will deliver rewards over the long time but can be compromised through greed. Don't overestimate your tolerance for pain and never assume you can ride out significant drawdowns.....we are just human after all. The whole basis of this system is to manage uncertainty and keep you in the game for as long as possible till those great trends emerge.
Be aware that cashflow is lumpy but don't lose heart as this approach catches every trend of substance.
Ensure that you are realistic in your expectations. All trend following systems encounter periods of difficulty. One of the significant benefits of this approach however is that you can sustain considerable poor trading conditions and a large number of consecutive losses without facing substantial drawdowns. Just remember that this trading approach will catch all trends of substance so if you believe that trends are a fairly regular phenomenon in the market then you can sleep well at night using this approach. This approach will quickly recover from poor trading periods once some trends of substance materialise.
Diversification in trend trading is one of your biggest benefits.
You can never anticipate when an instrument will commence trending so the following key rules are paramount in delivering regularity of income yield for a trend trader.
Maintain as diverse portfolio as possible provided you can ensure you maintain control of your trading. Once skilled in this approach a portfolio of up to 40 instruments is possible given that using 24 instruments, trade activity is only about 0.5 trades per day. Obviously you will need a number of trading screens, a good quality trading platform and you will need to work on your technique to progressively add to the portfolio over time. The stats from this strategy conclude that there is a favourable probability bias with this technique so the more instruments you trade, generally the better off you will be. If you trade more markets, provided you have a probability edge, you increase the chance that you will enounter conditions favourable to your trading system in at least one of those markets. Ideally these markets should not be highly correlated.
Be selective in your trade entries. Ensure that you trust your system and avoid listening to your gut instinct. Overtrading is one of your greatest obstacles with an approach such as this. With a large portfolio, you can afford to be selective. Don't lose sleep if you miss a trade.....there will always be others. Always monitor your statistics closely as it is a good way to detect when you are over-trading. You should be waiting till the instrument 'shouts out' to you that a trend is in place before entering.
Don't be too anal with your entries. Provided you trade within the SDC, you can enter at any time but my preference is to trade breakouts simply as they stand out to me as times when price action has high momentum in the direction of the prevailing trend. Those who are more patient might like to consider trading when price action moves through the mean SDC of the W1 chart to ensure that price is fairly valued during it's trend move. It is really up to you. Retracements upon entry are a common occurrence but provided you are within the H1 SDC and this channel is representative of the longer timeframe SDC's then all is ok. Just be patient and observe the rules of the system.
thank you copernicus for the amount of work you have put in! appreciate your effort very much and look forward to learn more from you. have a prosperous 2015 everyone!
Ignored
Thanks greatly jack for your words of support. It makes the effort worthwhile. Have a great New Year.
|
Commercial Member
|
Joined Apr 2013
|4,366 Posts
It's a bit early I know but thought I would get this out of the way during these market doldrums. It may run over a few posts so bear with me.
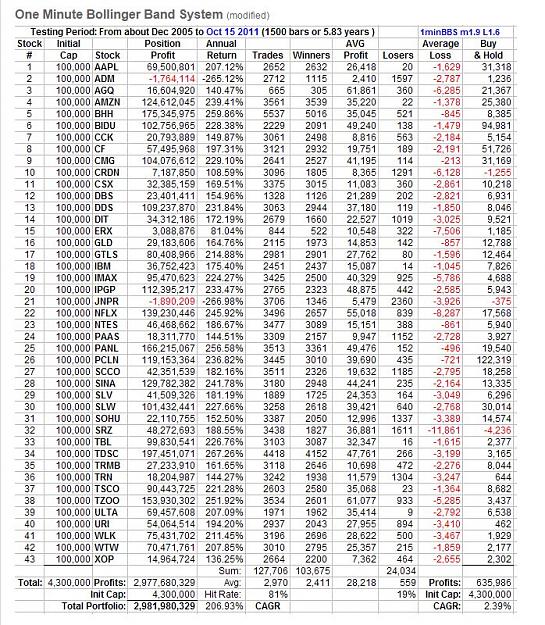
2014 Annual Review of the DTT Approach
Attached Image (click to enlarge)
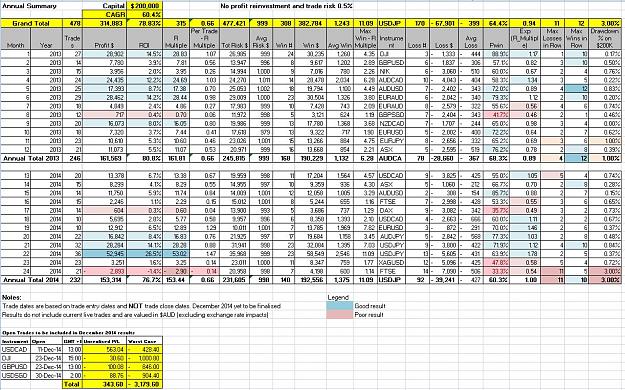
Notes to associated results The results presented in the Annual Summary above were based on backtest results for 2013 and forward test results for 2014. To keep realistic, the forward test results were a result of dedicated paper trading live (within reason) during 2014 to simulate realistic conditions and assist in my determination of the practicality and manageability of trades undertaken prior to live trading.....hopefully towards the end of 2015.
To compensate for possible bias, spreads adopted for this testing were conservatively estimated as twice the average spread across currency pairs and CFD’s used by IG Markets to ensure the results were conservatively pitched and allow room for financing costs and guaranteed stops where applicable. During paper trading sessions, orders and stops were based on pending orders as opposed to manually placed orders to resist any temptation to curve fit. Gaps were also included in this assessment despite the fact that I use guaranteed stops in live trading activities between market open and close when price is near to critical thresholds. The comparison of performance results between backtested and forward tested (paper trading) periods suggest that possible effects of bias associated with curve fitting were not material to the results.
Overview Trade performance for the 2014 calendar year was in line with the 2013 result producing a return of 76.5% (marginally below the 2013 return of 80.8%). The 2014 trading year delivered a risk multiple (R) of 153.21 as opposed to 161.81 for the 2013 year. The combined results for 2013 to 2014 produce a compound annual growth rate (CAGR%) of 60.4%. This return certainly is well beyond my expectations, so while I am very excited about the potential of this approach, I expect more subdued results in the longer term.
It must be noted for the purposes of this analysis, monthly performance is based on date of trade entry and not trade close. The reason for this is that it provides a reliable indication of the month when major trends commenced. Given that this analysis is based on date of entry there are still a number of trades entered in December which are still active and their results will be included in the final December 2014 result when closed (which may be months away). The overall result however is not anticipated to materially differ from the performance stated above. Currently if all active December trades were closed, the December 2014 result would be approximately a $2.5K loss for the month which still represents the first negative loss in the trading history of this approach. The following table provides information relating to current active trades for December 2014.
Attached Image
What is evident from the stats is that the performance consistency of this approach so far stands the test of time for the 2 trading years encountered. Furthermore all months excluding December 2014 were profitable for the strategy which augers well for the consistency and possible sustainability of this approach.
Now you may be thinking that an average return for a retail trading strategy of approximately 80% per annum is BS and I would normally join you in this scepticism......but let’s break this down in relation to trading this diversified trend trading strategy. If I was trading one instrument according to current results my average annual return on $200K would be 3.3% per annum. Does this help you to understand why trading a large portfolio of instruments can be rewarding. With 24 instruments this therefore allows you to reach such heady heights as this approach achieves...but there are caveats to consider. To maintain this average across your portfolio, you must ensure there is an expectancy bias in your favour and across the majority of your instruments. To achieve this, you must remove your tendency to overtrade and only press that trigger finger when a trend shouts at you and is in accordance with the dynamics of the trend on higher timeframes. The entire basis of this approach is to establish system constraints that assist you in staying in trend over the longer term timeframe and ensure that you only commit to a trade when clear signs exist that the market is trending and attributed to market consensus as opposed to simply random price movements that ‘look and feel like trends’.
For those traders who trade a single or a few instruments, the challenge to achieve sustainable and sufficient returns on an unpredictable instrument requires remarkable skill and frequently causes traders to ‘overtrade’ in an attempt to compensate. So significantly reduce your performance expectations on a single instrument and up the number of instruments you trade to compensate....provided that you can maintain control and discipline over the increased number of instruments.....and remember that you won’t get anywhere if you are not prepared to press that trigger finger.
I am naturally a nervous trader that excels at second guessing my rules and it has been a painstaking task to address my severe limitations. Those green predictive entry lines I draw are a result of continuous planning and forecasting based on current price action and they are continuously adjusted to ensure that a trend of likely substance is in place before committing. The trading sin for me is to see price move through those green predictive lines without assessing and taking action. A missed opportunity on a trend of substance that may be a seldom occurrence has a far greater impact on this approach than simply a wrong call that may cost me up to 0.5% of my trading capital. So exercising control AND taking action when the time comes are critical aspects of this approach.
It is important to note that the statistics relating to this approach assume 24/5 coverage of the market. For those seeking to adapt this strategy to more suitable hours for a single trader, you must be prepared to accept lower returns. It is possible, albeit very tiring to trade 24/5 using this approach as for many months of testing I have adopted this lifestyle while engaged in a demanding full-time business in preparation for trading live. The relatively low trading frequency just means you need to be available when the market calls and this can be at any time. Anyway sleeping is something you do when you are dead but it will have a drain on your brain and at times may cause duress so be warned.
One of the key requirements when going solo is for a robust trading platform from which you can trade by charts that utilise comprehensive contingent pending orders and alerts and allow for trailing stops set to inclined standard deviation channels. Without these features you will rue the day you ever got involved in this approach....... I am hoping however over time to engage a team of approximately 12 traders to work in pairs of 4 hour shift duration to trade this approach using a single account. The objective of working in pairs is that one of the traders supervises the other trader to ensure consistent application of the rules of this strategy and during oversight the extra trader is engaged in rigorously testing new instruments for inclusion, but that is currently a work in progress.
|
Commercial Member
|
Joined Apr 2013
|4,366 Posts
Some Key Factors for 2014
Salient features of the 2014 year are as follows
Low volatility and limited market direction saw poor performances in the months of Apr – Jun 2014. These periods were associated with low trade activity as opposed to excessive drawdowns that gives me confidence that the D1 filter is doing it’s job and preventing me from overtrading.
Excellent trending conditions for this strategy were experienced in Jan, Mar, Jul-Oct 2014. The reason for the exceptional returns in October can largely be attributed to the favourable move in JPY pairs and the Nikkei associated with Japan's QE announcement. The great performance during these periods gives me confidence that the risk management approach of this strategy is not too dominating and allows for room to breathe when trends of substance get under way.
The worst performing month for the entire test period was encountered in December 2014 associated with trend reversals and retracements with this approach. I noted with despair that other trend traders appeared to get through this period with far less heartbreak, so the market conditions simply did not respect this approach for that period.
Average trade profit per trade was remarkably consistent between 2013 and 2014 offering an average profit multiple per trade of 0.66R.
The win ratio for 2014 of 60.2% was below the win ratio of 2013 of 68.3%. The difference is not significant but needs to be closely monitored.
Despite the lower win ratio, trade expectancy was higher in 2014 (1.00 R Multiple) than 2013 (0.89 R Multiple). This suggests fewer trends in 2014 but with more substance. This can largely be attributed to the excellent October trending period.
A black swan event for this approach was encountered in December 2014 with 12 consecutive losses in a row. This result was certainly well outside the bell curve for this approach and signifies that ‘nothing is written in stone’. However the low drawdown associated with this event of 3.00% augers well for the aggressive risk management approach adopted by this strategy. Aside from this month, drawdown’s associated with this approach are minimal.
The 5 best performing instruments of the portfolio of 24 for the 2014 period were USDJPY, Nikkei, CADJPY, AUDJPY and DAX.
The 5 best performing instruments for the 2013 period were EURUSD, DJI, EURAUD, GBPUSD, NZDJPY.
The 5 worst performing instruments of the portfolio of 24 for the 2014 period were EURAUD, EURCAD, AUDCAD, GBPSGD and AUDUSD.
The 5 worst performing instruments for the 2013 period were NZDUSD, USDSGD, USDCAD, EURCAD, and XAGUSD .
The diversity of results from year to year across all instruments highlights that there is no strong performance bias associated with any instrument of the portfolio.
For the 2014 period, only one instrument (EURAUD) performed at a loss for the period. All other instruments contributed to overall profitability of the approach.
For the 2013 period, only one instrument (NZDUSD) performed at a loss for the period. All other instruments contributed to overall profitability of the approach.
The consistent performance amongst instruments in the portfolio highlight the importance of diversification for the strategy.
Consistency of income yield offered by this approach is patchy but certainly sufficient if trading for a living. It is essential to bank profits taken during boom months to pay the way for more subdued trading periods.
Risk:Reward Scenarios The 2013 and 2014 trade results are based on the following risk parameters:
This test uses $200K as required trading capital for this approach. Note that the percentage performance result would be the same for lower sums provided the trading approach mirrored this technique;
The test assumes that all profits are taken off the table and not reinvested in the strategy unless a residual top up is required from a losing month to bring the trading capital account to $200K;
The allowable risk per trade for this test is 0.5% of trading capital (or $1000 for a $200K account).
The maximum drawdown associated with these risk parameters was 3.00% which occurred in December 2014. This was just a shocker of a month where the stats fell into black swan territory for this approach. While this poor result is not currently a sign that this current approach needs amendment for current market conditions, it certainly gives a head up that no strategy is foolproof. More importantly these events provide a valuable test of the robustness of a strategies risk management approach. So every cloud has a silver lining. I could not be happier with the merciless management of risk during this period by this approach.
The 2 years of trading results allows me to make some bold conclusions regarding the anticipated R:R to be achieved through altering key risk management variables used by this approach. Scenario tests of risk:reward using different risk parameters are as follows:
Attached Image
Results conclude that enhanced performance within manageable risk parameters can be achieved with a risk per trade of 1.0%. If you are more risk averse or a fund manager seeking to deliver more modest but reliable returns, the lower R: R associated with a 0.5% risk per trade would be perfectly suitable.
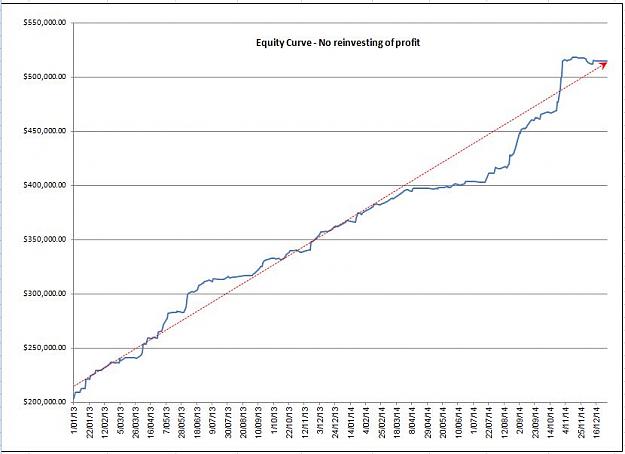
The equity curve associated with performance since January 2013 using this approach and 0.5% risk per trade is as follows. The impact of the poor trading result in December and associated drawdown following 12 consecutive losses is reflected in the chart below.
Attached Image (click to enlarge)
What has become evident with this approach (and with trend following approaches in general) is that periods of boom tend to be preceded by periods of poor performance. The poor trading result in December took some of the gloss of the excellent returns delivered in preceding months.
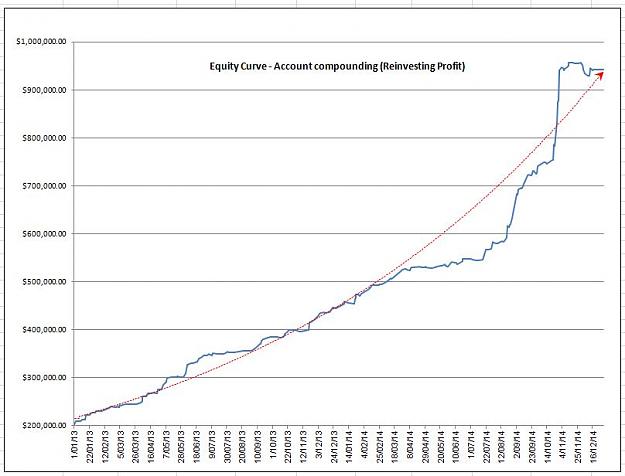
To reinvest profits or not?
Given the excellent trading performance over the past 2 calendar years in delivering a profitable income stream with low risk, the need to compound the account is not warranted. While account compounding (reinvesting profits) significantly enhances system profit performance, there is also the associated magnification of risk associated with drawdowns.
As a general guide , look at the historic drawdowns of your trading strategy and then double them to ensure a conservative position is adopted that allows you to sleep well at night.
The chart below reflects the result of trades assuming that profits are reinvested back into the strategy. Commencing from $200,000 with 0.5 % trade capital risk per trade, the ROI from account compounding over the two years would be approximately 375% to $941,000 or a CAGR of 135.3%. While the performance is stunning, associated drawdowns are also magnified so don’t let greed get the better of you.
Account compounding for this strategy is only recommended when you have an alternative primary income source and you wish to accelerate your returns to build your trading capital.
|
Commercial Member
|
Joined Apr 2013
|4,366 Posts
Conclusions
So far, I could not be happier. The approach currently achieves desired outcomes well in delivering a fairly consistent income with very low risk.
Future considerations for amending this approach which are a work in progress include:
Analysing correlations between instruments and refining the portfolio selection to achieve more consistent income yield;
Assessing the optimal positioning of the H1 SDC within D1 SDC to improve entry conditions, more effectively utilise mean reversion and optimise position sizing;
Increasing the instruments in the portfolio to further benefit from diversification; and
Closely reviewing mean reversion price action within the SDC to improve trade entries andavoid using breakout techniques that arise in the direction of overbought or oversold conditions.
Given the consistent performance of the approach to-date, there really is no need to alter trade variables at this stage such as the SDC width to stay in trends longer. The old saying buzzing around in my head at the moment is....If it ain’t broke, don’t fix it.
I have included my analytics spreadsheet for anyone that wants to delve deeper into the system’s performance characteristics.
Conclusions So far, I could not be happier. The approach currently achieves desired outcomes well in delivering a fairly consistent income with very low risk. Future considerations for amending this approach which are a work in progress include: Analysing correlations between instruments and refining the portfolio selection to achieve more consistent income yield; Assessing the optimal positioning of the H1 SDC within D1 SDC to improve entry conditions, more effectively utilise mean reversion and optimise position sizing; Increasing the instruments...
|
Commercial Member
|
Joined Apr 2013
|4,366 Posts
Thanks B :-)
I have been thinking of you and am hoping that you have put your feet up for a well earned rest over the festive period. Looking forward to a bit more collaboration with you and your trading technique next year. Let's hope its brings good results. My antennae is sensing a bit more volatility this coming year so it is going to be interesting to see how things play out for the trendies.
Thanks B :-) I have been thinking of you and am hoping that you have put your feet up for a well earned rest over the festive period. Looking forward to a bit more collaboration with you and your trading technique next year. Let's hope its brings good results. My antennae is sensing a bit more volatility this coming year so it is going to be interesting to see how things play out for the trendies. Have a great New Year. Regards C
Ignored
As you can see from my thread i wasn't, anyway here is a small gift to satisfy your nerdy Backtesting, optimization and Simulating Trading systems side, simply an incredible site.
Go through all the classic systems optimized and then some.
Last Trading day of the year, a USD retracement, an AUD change of direction (Both already hit their ADR for the Day) and the yen pairs are pointing us to a new game plan this new year, is it gonna hold ?.
{quote} Last Trading day of the year, a USD retracement, an AUD change of direction (Both already hit their ADR for the Day) and the yen pairs are pointing us to a new game plan this new year, is it gonna hold ?. Best. {image} {image}
Ignored
It certainly is picking up a bit of steam. Only a few hours ago I was complaining about the doldrums. My crash helmet is on and I am watching and waiting. I gotta say again, I just love your charts. They are brimming with useful info. :-)
|
Commercial Member
|
Joined Apr 2013
|4,366 Posts
Thanks to that very rigurous website B. I thought I would highlight some interesting information drawn from a sample of articles relating to how to take advantage of unpredictability in the market through a longer term trending approach such as this.
Randomness and the compounding influence of non-random bias (drift) - http://alphapowertrading.com/index.p...-on-randomness
Whatever your view of the market, being random or not totally random, if there is a minimal non-random component in price, that small bias will compound over the longer term. There is considerable reason to consider that there is a small bias in the market as this is the basis upon the proven long term 'buy and hold' strategies applied in the equities market and fundamentally the only reason why there are traders and investors. Remember that a trader participates in trading price action in a the same way an investor does. The methods employed and the underlying motivations and decisions however are vastly different.
The Drift - http://alphapowertrading.com/index.p.../160-the-drift
A very interesting viewpoint that highlights the game of chance in the shorter term timeframe versus the natural tendency in the longer term for price to oscillate around consensus value leading to trends with a substantial non-random built in bias.
Note that these articles are not criticizing short term trading but simply outlining how a long term trend trading approach is more applicable to simple trading strategies. There are some very powerful gaming systems applicable to the short term timeframe that can keep you in market for a long time and with luck bring considerable fortunes, however I do not have the guts to step into this arena again unless it represents a small but high risk component of my game. I have been there and done that.....but using these approaches did not work for me. I was just another victim.
|
Commercial Member
|
Joined Apr 2013
|4,366 Posts
Features of trends that are addressed by this approach
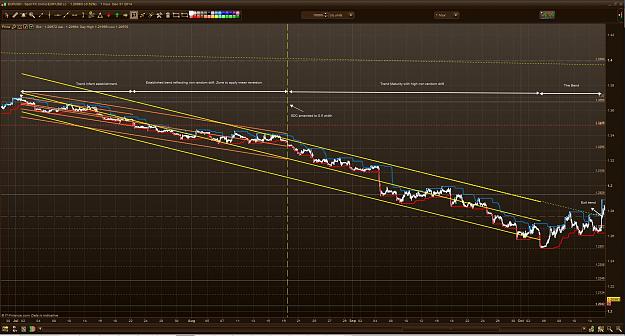
Following on from post 172 I thought I would highlight how this approach seeks to capture a drift in probability bias using this technique. The discussion below relates to typical phases of trend development that have a long term non-random drift underlying their movement. Note that the key to a long term trend analysis approach is to filter out those 'random trends' from 'long term trends with an inbuilt positive bias'.
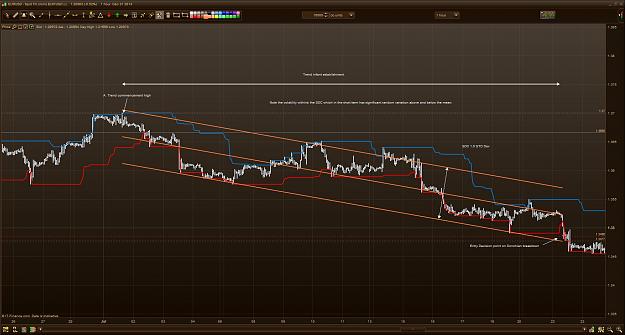
Diagram A below represents the infant stages of a nice long trend in EURUSD that was ridden by this approach in July 2014.
Attached Image (click to enlarge)
Note that during infant stages of trend development, it is very difficult to sort the chaff out from the wheat. It helps to have a fundamental viewpoint to assist in determining whether a possible positive bias exists or not. Without that knowledge then your decision making is assisted by viewing the trading timeframe in conjunction with higher timeframes to assess their validity.
During these infant stages, there is considerable volatility around the mean price movement (represented by the centre line or 'regression line of best fit' of the SDC) given the dominant impact of unpredictable price movement in this short timeframe. You can see in the diagram below price movement occupying the entire channel represented by the 1.0 SDC. At this stage of trend development using this approach you are effectively crossing your fingers that there is a non-random bias built into this price movement. You have analysed the M1, W1 and D1 timeframes to hopefully convince you that a drift exists, but as per normal.....there are no guarantees. You have also assessed where price currently sits in relation to the higher timeframes to determine whether price is in an overbought or oversold condition in relation to the potential trend you wish to ride (not examined in this post) ....so now you wait for your entry signal, which in this instance was a Donchian breakdown.
So now we are in........and we ride the beast managing the position all the way using the SDC (not explained in this post) to reach our interim target of 2.5R where we make some adjustments.
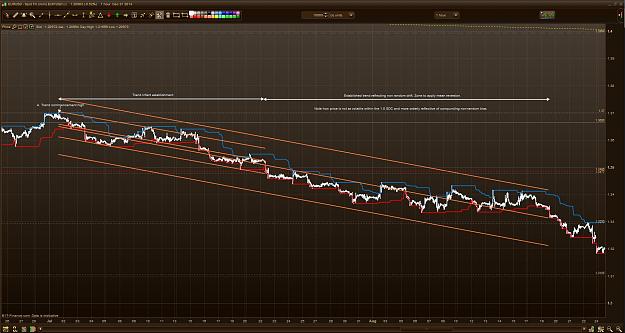
Diagram B below represents what I refer to as the trend establishment phase of development where signs of non-random drift start to occupy a progressively greater component of price movement variation.
Attached Image (click to enlarge)
Points to note about this phase is as follows. A 1.0 width SDC is still applied at this stage to give room to breathe however for a trend of substance, you should start to see signs that non-random drift is starting to build up steam and occupy a progressively greater component of price movement. Have a close look at price movement within the SDC during this phase and you will note that volatility is far lower and does not occupy the entire channel despite the fact that this channel still represents the same standard deviation of price movement as the infant stage. This feature is indicative that consensus is building in participants regarding the intrinsic price of the instrument and its trajectory.
Given that you have a more stable and orderly trend in place with less random movement impact, this is the phase to start considering approaches that utilise mean reversion techniques to accumulate your position (if you are so inclined). I am yet to incorporate this element into the approach but it is a work in progress. What I mean by mean reversion is when price movement clearly overshoots the line of best fit and begins to revert back to this consensus line. More on this later.
Now note at this stage using the SDC you are getting into solid profit stage and the 1.0 STD channel is more than sufficient to accommodate random jitters. Having reached 2.5R you now need to address how to protect some of that profit as unfortunately all trends must end. For those who are striving for infinite yield, then your need to get defensive is a later decision.
Diagram C below represents what I refer to as the Mature Trend phase of development.
Attached Image (click to enlarge)
Now you need to note that I have already reduced the width of the SDC by half to 0.5 (represented by the yellow SDC). Even with this significant reduction, price volatility is far more stable that the infant stage of development. Have a close look at price movement and you will see it distinctly occupies sections of the SDC as opposed to fluctuating between extremes. During this period, non random drift starts to become prevalent attributed to the building consensus of participants that we are in a bear trend. You would not like to face this stage of the trend head on with a contrary position. It will charge over you like a rhino.
During this phase I start to get defensive as I am seeking to protect my profits so while tempting to use mean reversion to accumulate positions, I tend to avoid this desire. This is where you put your feet up and relax and let the drift do its trick. You have earned a break at this stage.
Diagram D below represents the bend.
Attached Image (click to enlarge)
All trends come to an end........and this is how it usually plays out. Volatility within the SDC starts to rise with greater uncertainty and the increased influence of randomness into price movement. There can be some spectacular movements here and if you are on the right side of them, they can be icing on the cake. This is symptomatic of a lack of consensus amongst participants and significant ensuing volatility. However your job has been done so just enjoy battle going on with participants.
I hope this helps to explain the method in this madness.
It's a bit early I know but thought I would get this out of the way during these market doldrums. It may run over a few posts so bear with me. 2014 Annual Review of the DTT Approach {image} Notes to associated results The results presented in the Annual Summary above were based on backtest results for 2013 and forward test results for 2014. To keep realistic, the forward test results were a result of dedicated paper trading live (within reason) during 2014 to simulate realistic conditions and assist in my determination of the practicality and manageability...
Ignored
Great thread!! Just curious if you have the excel template that you used to calculate and track your progress available for download?
I would love to adapt it for my own strategy.
Many thanks coppernicus, for sharing your knowledge with us ... Happy New Year and Best wishes to all.
Ignored
Thank you Thx. It is great to share the passion. I hope you have a fantastic 2015.
At GMT+10 we are well into the 2015 year as I speak and the birds are chirping....but my friends over in Middle Earth *puts on Gandalf hat* are sensing some strange behaviours from the woodfolk. We might be in for a volatile ride this year with those currencies associated with the Antipodeans. Stay safe. :-)
{quote} Great thread!! Just curious if you have the excel template that you used to calculate and track your progress available for download? I would love to adapt it for my own strategy.
Ignored
Hi Voro
Post 166 contains the latest download so at a pinch you can use that by over-riding the data. If you are familiar with Excel there will be no problem provided you keep clear of deleting any cells with formulas.
I use MSAccess (2007) to capture the data and hold the charts from which the data is then dumped into Excel for Analysis to make life easier for me. I can send you this Dbase if you already have a version of Access which can handle it and then run you through the systems if you would like, but it is a bit of a learning curve. If you would like to go this route, then please send me a PM and we could do this by dropbox as the dbase file is large.
|
Commercial Member
|
Joined Apr 2013
|4,366 Posts
To Catch the Drift if You Get My Drift
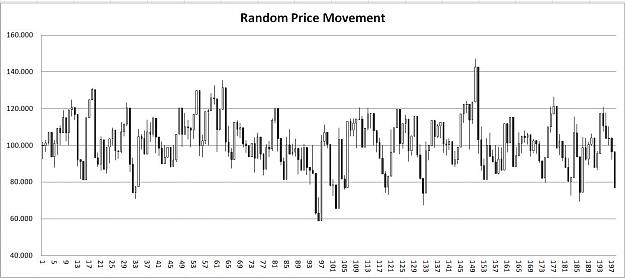
I have been playing around with random price generators today as per posts 172 and 173 to assess how to distinguish between random trends of no predictive power and trends with an element of non-randomness that provide subtle clues that they are backed by emerging order and hence have a component of predictabiliy about them.
Below is a simple random history of prices over a 200 period interval with a per period price variation range of 5%. This chart is fairly representative of all random price series I have generated today. All you have to do to generate them is press the recalc function.
Attached Image (click to enlarge)
There are a number of periods in this range that would have caught my attention as a trend trader as signs to possibly jump into a trend. For example from period 77 to 97, price signals would have suggested a short trend was shaping up and the apparrent breakdown at period 97 would have possibly had me in using a breakout signal. There are also typical chart patterns and price action signals that may have influenced traders using a range of techniques to take action with this price series..........but it would be only through chance alone that the decision made may have been favourable or not. There is absolutely no predictive power in this random price sequence. At any point in this price series, each price point was independent save for the being within a 5% price variation of the preceding price point. The lesson here is how do you ensure you are not just reading tea leaves?
Take a moment to consider this carefully as you read your charts as there is always an inherent random component of price movement on any time frame attributed to the vast number of market participants each with their own agendas. We all know this is a game of chance however most of us are looking for an edge to provide the glim hope of positive expectancy over the long term.
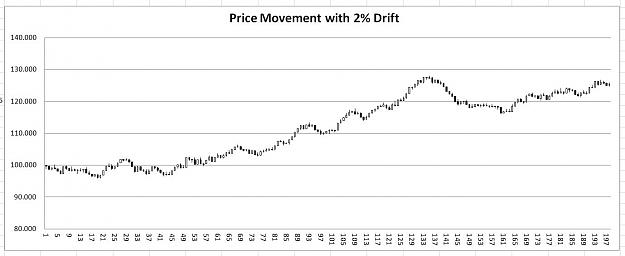
Now, what about if there is a small element of non-random price movement in the time series. This really is a game changer and it's effect becomes more pronounced over the longer term timeframe.
Below is a chart representing dominant random price movements but with a subtle positive bias of 2% in underlying price movement per time period. Note that there is a linear bias between time periods and not a compounding bias associated with typical cause and effect creep that occurs in complex systems. Compounding bias is an even better story than linear bias for the trader seeking order in chaos and predictive power in price movement. Note that random price movement is still represented in this price series, but the influence of drift provides a small foundation of order to the series.
Attached Image (click to enlarge)
You may be familiar with how order can emerge within closed complex systems. Boundary constraints imposed on complex systems is the way life extracts order from natural systems by harvesting negentropy from physical systems. Local influences from gravitational effects impart local boundary constraints allowing for order to be preserved in an othwerwise expanding universe. In the same way, boundary constraints imposed in complex financial systems such as a finite money supply allows economies to operate, risk to be managed and attracts the investment community as well as speculators. .....I could go on waxing lyrical but you get the drift.
Now back to trading.....Closely look at the inherent differences between the random price chart and the price chart with drift. Salient features of note is that the bias is reflected in extended directionality of price movement. This is the principle way to define whether price movement is random or has a non-random bias built into it. To observe this however you need to be patient and observe price movement over a longer timeframe to be able to participate in this directional bias. The SDC used by this approach is your prior weapon to assess the volatility and directional nature of price history so it really helps to understand its intricacies. Extend your SDC over a sufficient range of prices and closely examine the nature of price movement within the channel. It is your best friend.