All -
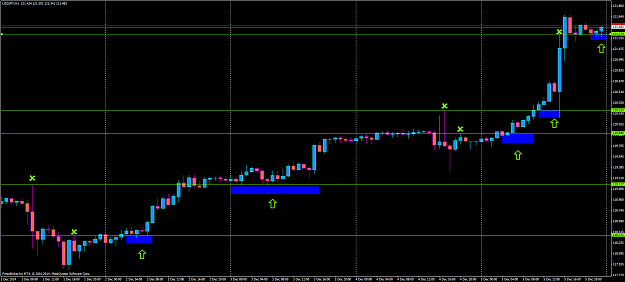
Here's a chart I said I would post showing recent opportunities. Simply wait for price to hit resistance, and then wait for that resistance to subsequently become support, it will either bounce, and move away, or start consolidating above the resistance point. Either way, it is showing bullish rejection of the resistance turned to support.
Last week there were 5 such opportunities, and if you would have just traded a 1:4 or 1:5 R:R on each one, you would have made out quite well. Or if you are longer term, it was 5 opportunities to add to your positions (5th one is still in progress).
H1 chart X shows key resistance, and arrows show entry point. The blue shaded area shows a few hours allowing time for entry, and in some cases several hours. This is a key point, that shows there's usually no rush. If you trade this way, you can relax and wait for the setup, and if you're not sure, just wait an hour or 2, and it will become more clear that the price has found support and is a good entry point.
Latest entry, the 5th one, RTM also posted, and is similar to mine as well. Looking at this chart, is there any reason to believe it won't work out as the other trades did? We will see...
Edit: One reason I posted this, is I wanted to kind of give a preview of what I'm hoping will be the kind of trading this thread will promote. Trading that is very simple, and stress free. USDJPY in uptrend, just wait for resistance to become support and jump in! We can discuss SL and TP placement as well as we move forward. Could it get any simpler than that? I mean, in retrospect these trades could have been taken without even looking at any other time frame. Let's see how simple we can make trading!!
Attached Image (click to enlarge)