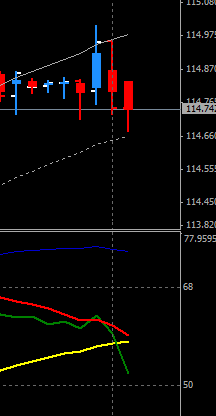
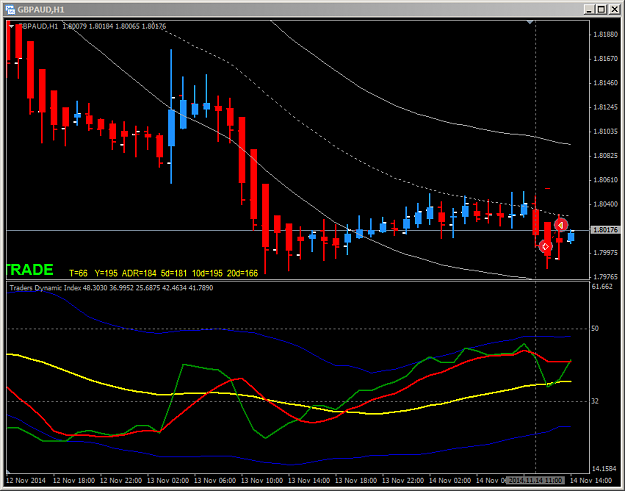
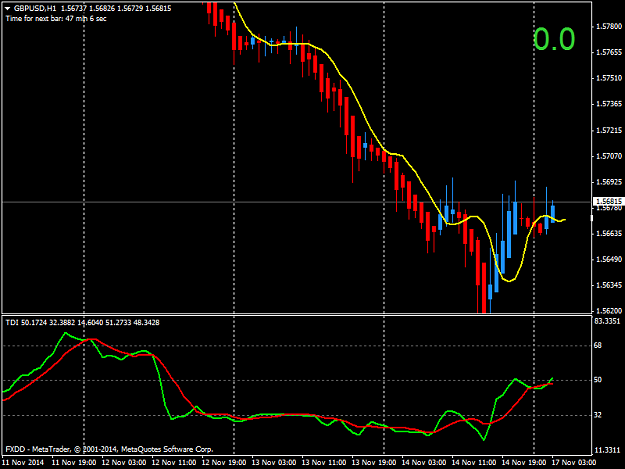
Hi Goorman. Is that an h1 chart? Your candle looks different than mine. Which is strange, I can understand h4 and higher being different due to broker time zone, but not h1.
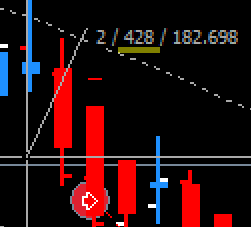
This candle right here was the result of many news. When such news hit I try to let the dust settle before making decision, so in this case I wouldn't be taking this trade. Green didn't look too bad, it was a bit above 50 but the angle was so sharply down.
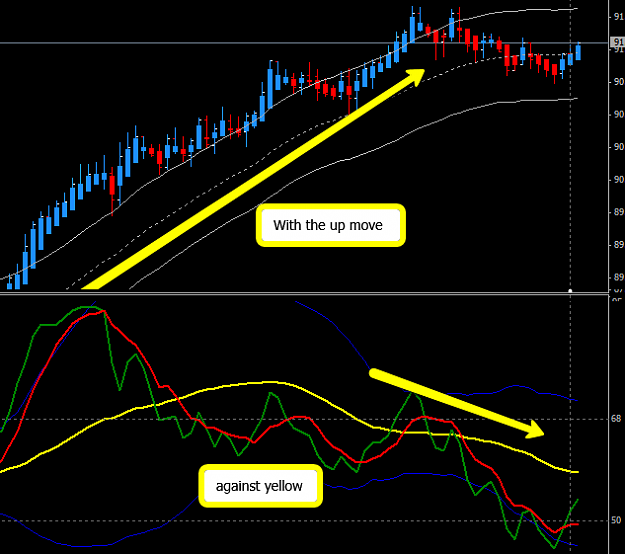
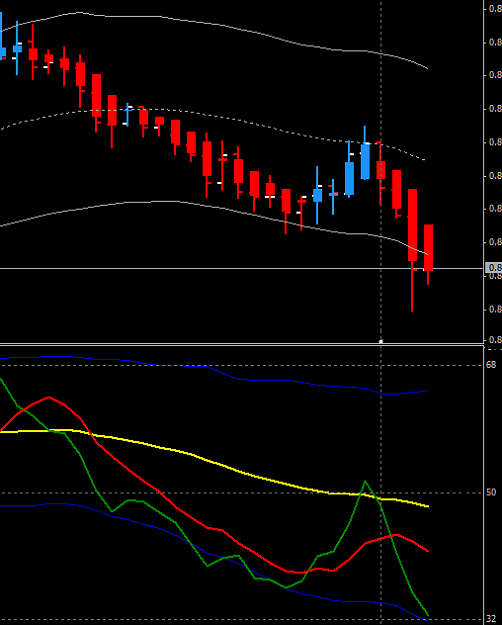
To take this trade you would consider a few things beyond this thread. I'll point them out but don't let them confuse you
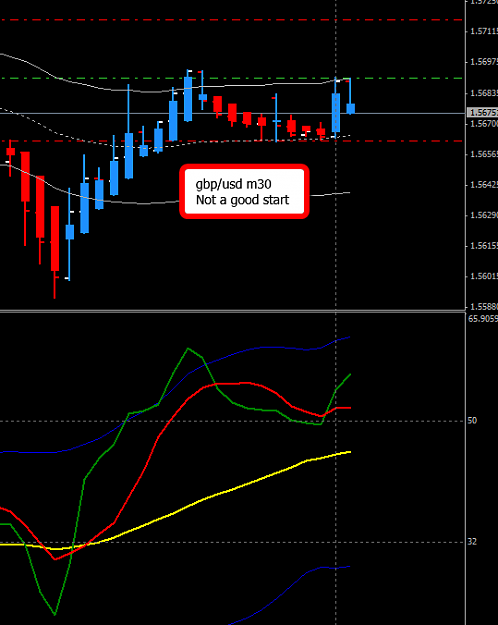
- Price made double/triple top
- Price rejected longer period MA (in your screenshot is 200 MA?)
- Rejected flip zone, meaning this level had served as both support and resistance before.
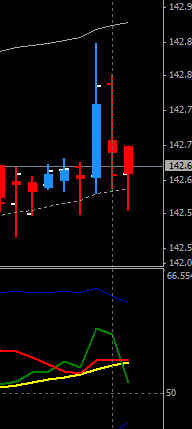
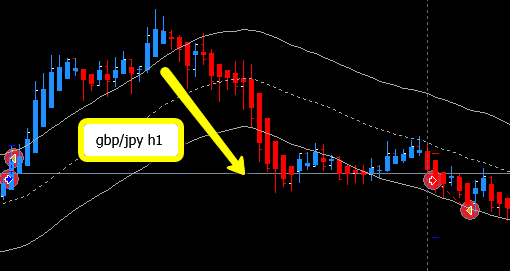
The cross looked a lot better on my h4 chart.
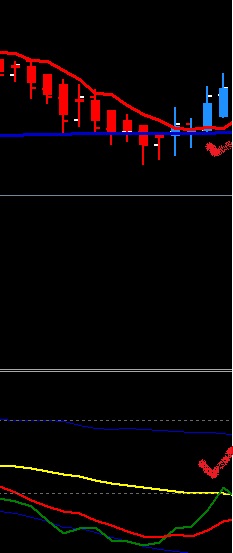
The trend was down, green heading below 50 with plenty of room to fall, red turning down as well.
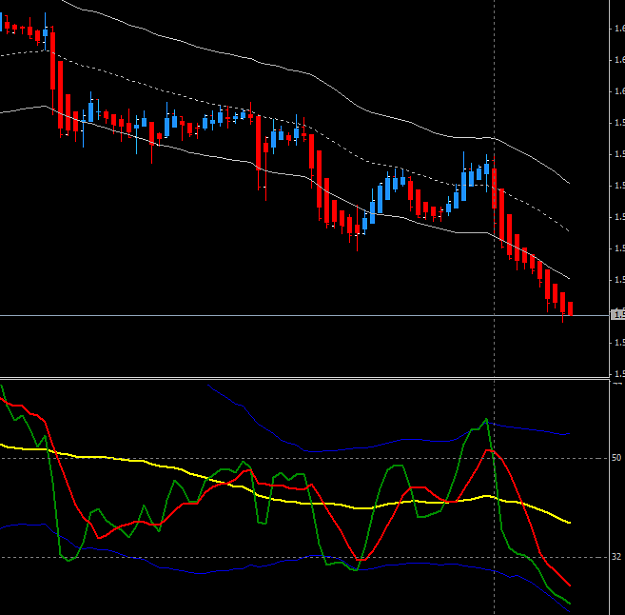
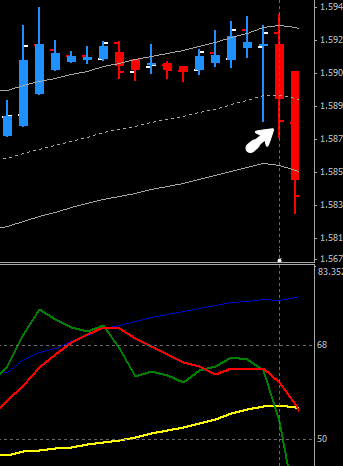
This candle right here was the result of many news. When such news hit I try to let the dust settle before making decision, so in this case I wouldn't be taking this trade. Green didn't look too bad, it was a bit above 50 but the angle was so sharply down.
Attached Image
Attached Image (click to enlarge)
To take this trade you would consider a few things beyond this thread. I'll point them out but don't let them confuse you
- Price made double/triple top
- Price rejected longer period MA (in your screenshot is 200 MA?)
- Rejected flip zone, meaning this level had served as both support and resistance before.
The cross looked a lot better on my h4 chart.
The trend was down, green heading below 50 with plenty of room to fall, red turning down as well.
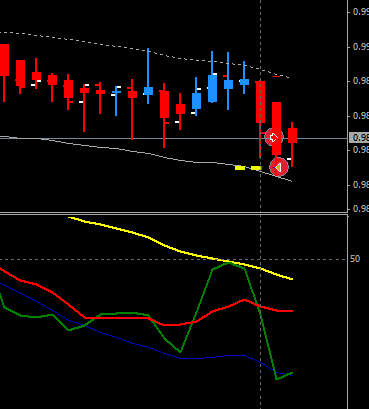
Attached Image (click to enlarge)
Everything you can imagine, is real - Pablo Picasso