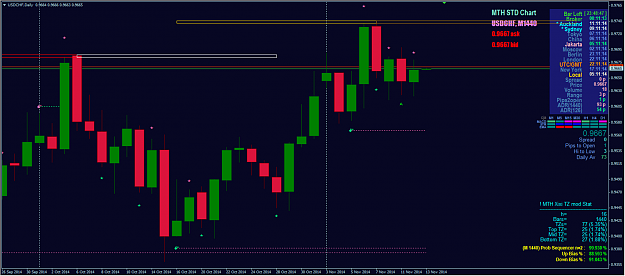
{quote} LOL... what can I say.. USDCHF H4 bearish final form.. {image} {image} On Friday, whatever the result of my testing phase..., i will share all my indicators and mod also template to all of you.. (but sorry no mql files).. and we can test it together and discuss it here.. if you want to.. Happy trading guys.. MTH
Ignored
Looking forward to see your test result. I may have an idea how to use the star indicator, I am going to send you a PM soon.
{quote} many thanx Kiads how would you trade this on the D1 I would think one might set a sell limit or sell stop above the d1 open.. say 25 pips ? what do you think
Ignored
In my testing phase i do like this example picture, and go to lower TF to search another 'star' that in same direction with the 'daily' star.
Attached Image (click to enlarge)
and also let see what will become with AUDUSD D1 today..lol
{quote} LOL... what can I say.. USDCHF H4 bearish final form.. {image} {image} On Friday, whatever the result of my testing phase..., i will share all my indicators and mod also template to all of you.. (but sorry no mql files).. and we can test it together and discuss it here.. if you want to.. Happy trading guys.. MTH
Ignored
Nice of you Kiads look forward to it .
Regards Orid peter
and now for today USDCHF Daily chart... let see if i can trust her or be cheated ..lol {image} MTH
Ignored
Hi All,
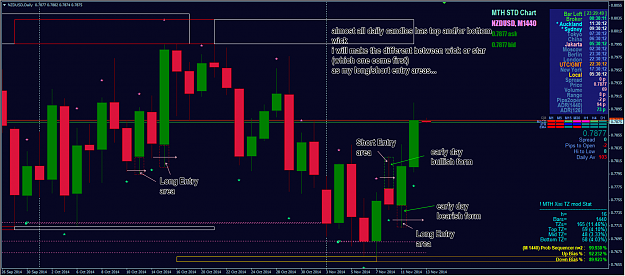
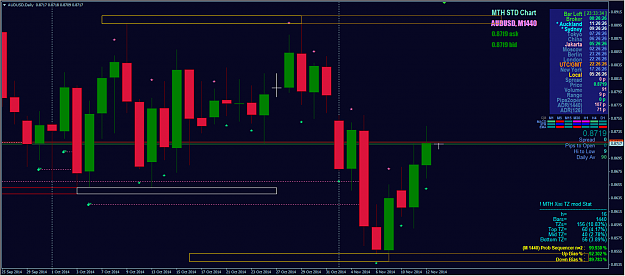
as you can see for yourself daily candle of USDCHF, AUDUSD and NZDUSD final form match with 'star' direction...
but today there's no 'star' signal at all.. in all majors.. lol something weird happen..
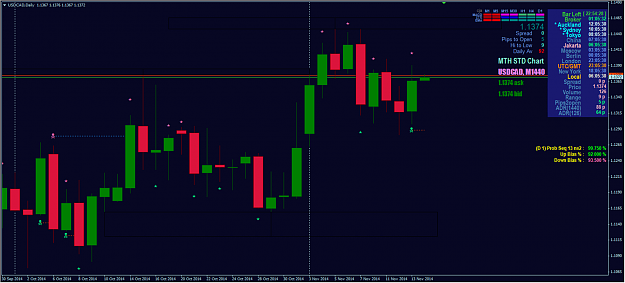
The only 'star' i get is USDCAD Daily
Attached Image (click to enlarge)
BTW, i need more time to fine tune this sub-seq indicators so please forgive me i can't share it today.. maybe next week
I find something interesting about prime numbers 13 and 413, so let's called this tools Friday the 13th... lol.
Let me explain in general term, the basic of this tools;
For n=2, instead of use 5 price values, I use 13 price values, so if with 5 price values we get 4 sub-sequences > and <, then with 13 prices values we will get 21 sub-sequences > and < . For Daily chart that 21 branches will cover 1 month.. and as I mentioned before that I'm not a math guy, I just try to use my old brain logic to find out something.
and this tools will calculate the last 413 bars/candles in every TF.. nothing special about 413 candles just one of prime number within same row with 13 (some kind of DNA but from my own interpretation..lol)
You can see that this 'row of prime numbers has 'constant' step.
3 - this is the base
13 - this is our 13
23 - 10 range from 13 lets mark it as 0
43 - 20 range from 23 lets mark it as 1
53 - 10 range from 43 lest mark it as 0
to...
413
and the chain will be 01010101. to infinity..
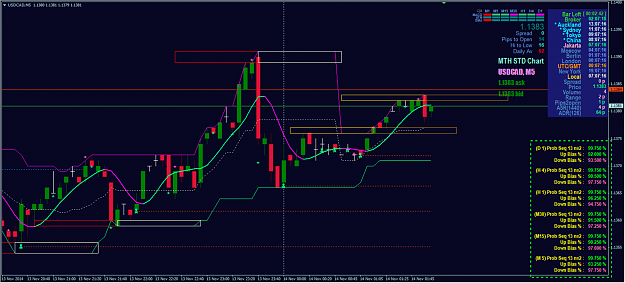
and when we applied this 413 bars to our 21 sub-sequences of 13 bars (from 0 to 12), we will get probability in exactly 99.750% for all TF with bias step of 0.250% or if you understand basis point this is 1/10 basis point in financial world. or 1/400 of 100%.
So, for example you will see stat like this on your chart;
Attached Image (click to enlarge)
that represent next candle bias in any TF.
Ok Guys, once again please forgive me that i can't share it today, please be patient, I will share it later after I'm satisfied with the result, or at least i can reduce the risk to minimum.
{quote} Hi All, as you can see for yourself daily candle of USDCHF, AUDUSD and NZDUSD final form match with 'star' direction... but today there's no 'star' signal at all.. in all majors.. lol something weird happen.. The only 'star' i get is USDCAD Daily {image} BTW, i need more time to fine tune this sub-seq indicators so please forgive me i can't share it today.. maybe next week I find something interesting about prime numbers 13 and 413, so let's called this tools Friday the 13th... lol. Let me explain in general term, the basic of this tools;...
Ignored
Hi Kiads
I appreciate your work and your effort
for 13 price values do you use 4 candle pattern like x1>x2>x3>x4 ( or you use another number not 4 )
if that what you use there is 22 sub-sequences not 21
also my friend Kiads if you use that and there is candle meet the condition within the last 13 price value how can you predict the forward one ( as if the condition meet we have at least 9 price value " 13-4" ) meet one condition)
sorry i discuss what i understand by not proper way or may i didn't understand yet
please clear it to me
Thanks my friend Kiads
{quote} Hi Kiads I appreciate your work and your effort for 13 price values do you use 4 candle pattern like x1>x2>x3>x4 ( or you use another number not 4 ) if that what you use there is 22 sub-sequences not 21 also my friend Kiads if you use that and there is candle meet the condition within the last 13 price value how can you predict the forward one ( as if the condition meet we have at least 9 price value " 13-4" ) meet one condition) sorry i discuss what i understand by not proper way or may i didn't understand yet please clear it to me Thanks...
{quote} Hi My Friend, 0 > 1 > 2 1 > 2 > 3 2 > 3 > 4 ........... >12 0 > 2 > 4 2 > 4 > 6 ............. > 12 0 > 3 > 6 3 > 6 > 9 ..............> 12 and so on... Hope it help and best regards MTH
Ignored
Hi my friend Kiads
Oh Thanks
i miss somthing as i use 4 price value in pattern but repeat values
something like that
0>1>2>3
1>2>3>4
........>12 (10)
0>2>4>6
1>3>5>7 (problem here)
2>4>6>8
3>5>7>9 ...........
...........>12 (7)
0>3>6>9
1>4>7>10
2>5>8>11
3>6>9>12
. ..............(4)
0>4>8>12 (1)
....
Thanks my friend for your discussion
but what about the other part of my post
if there is condition meet inside the series (specially at the end ) how can you predict the next candle (as it is inside series have at least one sub sequence )
Sorry for my bad language as the English is not my native
{quote} Hi my friend Kiads Oh Thanks i miss somthing as i use 4 price value in pattern but repeat values something like that 0>1>2>3 1>2>3>4 ........>12 (10) 0>2>4>6 1>3>5>7 (problem here) 2>4>6>8 3>5>7>9 ........... ...........>12 (7) 0>3>6>9 1>4>7>10 2>5>8>11 3>6>9>12 . ..............(4) 0>4>8>12 (1) .... Thanks my friend for your discussion but what about the other part of my post if there is condition meet inside the series (specially at the end ) how can you predict the next candle (as it is inside series have at least one sub sequence ) Sorry...
Ignored
Hi,
do the whole sequences to filtering price position where the probability is highest, when you find it, do another 2 sequences separately only for > and < then compare the result, to determine direction.. just like that.
next stage, do the above steps to all major pairs, to find market level position and again do another 2 sequences separately to determine where the market goes.. and mark it back to your pair as general direction.. according to your pair types xxxusd, usdxxx or crosser.
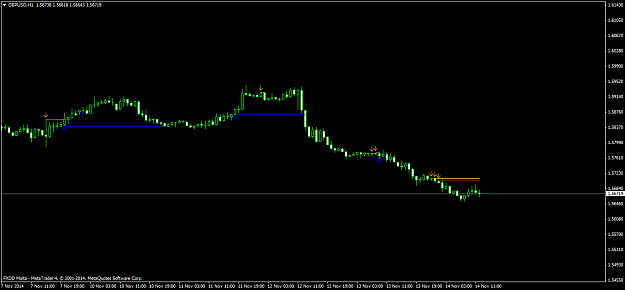
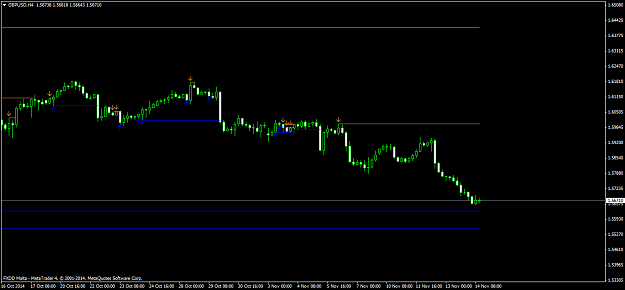
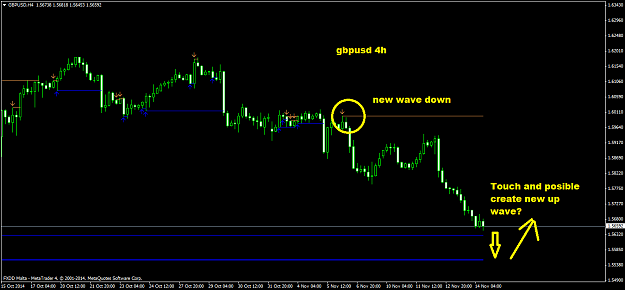
I want to ask if there are ways to predict who can play first line price, we know that line is more likely to be completed?
Here we see the GBPUSD in 1H having lines up, but graphics 4H has lines down it seems to want to complete.
Hello Kiads. I want to ask if there are ways to predict who can play first line price, we know that line is more likely to be completed? Here we see the GBPUSD in 1H having lines up, but graphics 4H has lines down it seems to want to complete. Can you help? Thanks. Natalia. {image} {image}
Ignored
Hi My Friend,
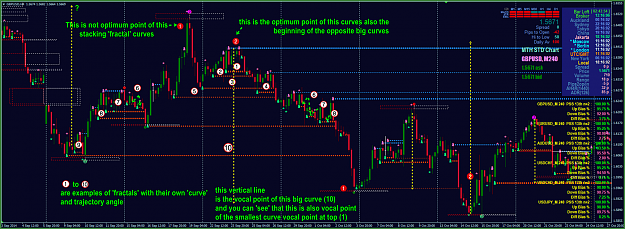
Visually you can imagine that every 'prices' are starting point of parabolic curves with their own 'trajectory' there is big curve and small curve and big curve always consist of several small curves until the smallest curves that not trade-able for us (retail traders) but still profitable for HFT companies out there..
this smallest curve that only one 'tick' up and one 'tick' down are 'fractal' that become component or building block of bigger 'fractal' and so on .. to create biggest 'fractal' that need several years elapse time.
This Probability Sub-Sequences is the way to 'mark' where the 'demand' or 'supply' start, it just similar to supply demand indicator, but the important different is, if Supply demand Indicator 'marking' history supply demand areas, while this PSS indicator, mark new supply or new demand, and following 'their' curve until met their counter part (another supply /demand) that will create turning point and move back to their own starting point. (every one of it).
You can see this example of GBPUSD H4 and the explanation about 'fractal' curves;
Attached Image (click to enlarge)
Of course your probability sub-sequences 'accuracy' calculation will determine the way this 'real' curves appear visually in your chart. The Key is, if the 'starting' point of the curve 'appear' in several time frames in same position, then the probability that this one become 'perfect curve' will be higher.
{quote} Hi My Friend, Visually you can imagine that every 'prices' are starting point of parabolic curves with their own 'trajectory' there is big curve and small curve and big curve always consist of several small curves until the smallest curves that not trade-able for us (retail traders) but still profitable for HFT companies out there.. this smallest curve that only one 'tick' up and one 'tick' down are 'fractal' that become component or building block of bigger 'fractal' and so on .. to create biggest 'fractal' that need several years elapse...
Ignored
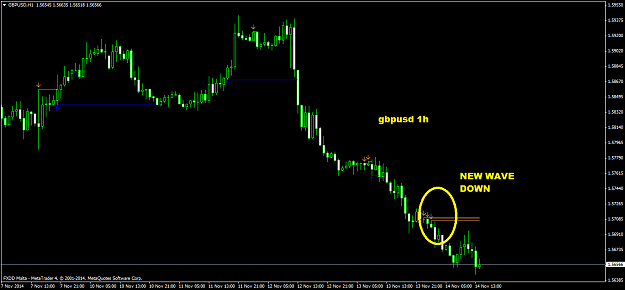
WOW! explanations are a luxury. not know how to thank.
I think I understand well.
We can have a goal to reach, but the ripples are what we usually play our stop and possibly believe that the market is changing trend. It is the general belief worldwide.
As we can better see those waves? TZ indicator is good to see these changes?
Or I can do it the way that marked on the chart?
Is there any indicator that can help us with that?
{quote} WOW! explanations are a luxury. not know how to thank. I think I understand well. We can have a goal to reach, but the ripples are what we usually play our stop and possibly believe that the market is changing trend. It is the general belief worldwide. As we can better see those waves? TZ indicator is good to see these changes? Or I can do it the way that marked on the chart? Is there any indicator that can help us with that? Thank you Natalia {image} {image}
Ignored
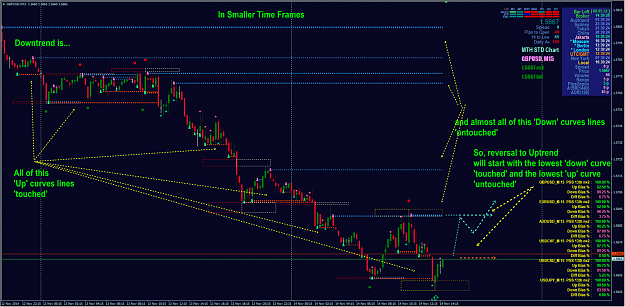
Hi, If you can't see it clearly in Higher Time Frames, you can go to lower Time Frames to see 'evidence' that trend will continue or reverse or at least 'retrace' and 'pullback' just by comparing the opposite lines.. status..
Sorry, my bad.... i have problem with the combination, found 23+23=46 x combination..duhh. hope anybody can pinpoint where i did it wrongly 0>1>2 1>2>3 2>3>4 3>4>5 4>5>6 5>6>7 6>7>8 7>8>9 8>9>10 9>10>11 10>11>12 ->11x 0>2>4 2>4>6 4>6>8 6>8>10 8>10>12 ->5x 0>3>6 3>6>9 6>6>12 ->3x 0>4>8 4>8>12 ->2x 0>5>10 ->1x 0>6>12 ->1x ---------------------- = 23 x - 0<1<2 1<2<3 2<3<4 3<4<5 4<5<6 5<6<7 6<7<8 7<8<9 8<9<10 9<10<11 10<11<12 ->11x 0<2<4 2<4<6 4<6<8 6<8<10 8<10<12 ->5x 0<3<6 3<6<9 6<6<12 ->3x 0<4<8 4<8<12 ->2x 0<5<10 ->1x 0<6<12 ->1x ---------------------...
Ignored
My Friend you can search wikipedia for real analysis and sub-sequences and with n=2 that meant both must be in equal length
and 0>1>2 or 0<1<2 is one combination not 2 because it's branching to up or down. 0-1 =-1 1-2 =-1 or 2-1=1 1-0=1 the result is equal.
you miss this 6>6>12
and yes all of sequence is 22 but i don't use 0 > 6 > 12 or 0 < 6 < 12 because with 21 sequences I already reach 100% stage, so no need to sequencing further..