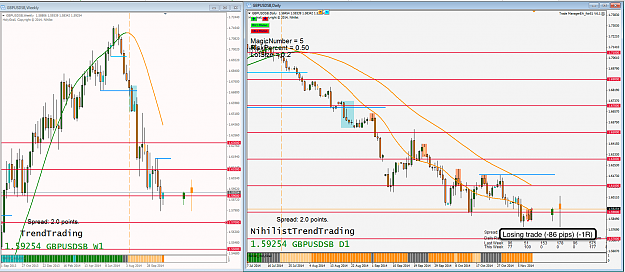
GBP/USD W1/D1 USD is still Bullish, across most pairs, even after Fridays worse than expected NFP result. This trade is in line with the Weekly trend and is coming off Resistance and RN. {image}
Ignored
GBP/USD W1/D1
Losing trade, looks like I should have been trading JPY pairs.
No matter what you do we are all going to get losing trades.
It's important to be trading at a level we are comfortable with.
If taking one losing trade hurts imagine what taking a series of 5 or 6 losers in a row would be like.
Everyone needs to be aware of losing runs and the random distribution of winning and losing trades.
This is a good article about this and a good site for picking up a lot of "free" information
Joined Dec 2010
|
Status: Never Stop Learning
|5,972 Posts
[quote=Xbd14;7863249]{quote} sorry for the trouble. But i am unable to set weekly and monthly candle. what parameter to use. it says invalid time frame. Thanks[/quote
{quote} sorry for the trouble. But i am unable to set weekly and monthly candle. what parameter to use. it says invalid time frame. Thanks[/quote Hi Xbd, TimeFrame Weekly = 10080 TimeFrame Monthly = 43200
Weekly resistance 1 was hit . Took a short 2 minutes ago . Gonna let it run . If i see is a PB of the weekly trend then i will close it as soon as nihilist indi's show me that it is really a PB . SL 145.00
Weekly resistance 1 was hit . Took a short 2 minutes ago . Gonna let it run . If i see is a PB of the weekly trend then i will close it as soon as nihilist indi's show me that it is really a PB . SL 145.00
Ignored
Hi purec,
Which pair are you talking about? And can you post an image please.
Personally a short here is extremely bad trade and is NOT justifiable. Japanese PM is set to dissolve the Gov't. You're swimming upstream against the tide. Picking tops and bottoms is not a good trading strategy IMO. Resistance/Support is there to be broken or use to trade WITH the prevailing trend when you receive confirmation. You're also NOT trading nihilist system.
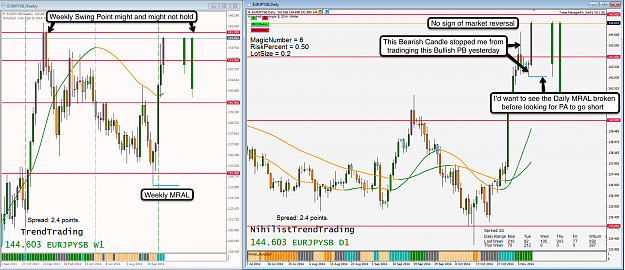
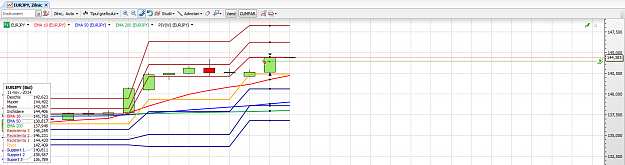
{quote} Hi Purec, Be careful with jumping into a Short trade here just because the market is nearing Weekly Resistance. We need to see the Market Reverse and, at least, break the Daily MRAL before considering looking for PA to go Short. Support/Resistance is used to look for PA to take trades in the direction of the prevailing Higher Time Frame Trend. {image}
Ignored
When you wrote this post I put TP at 144.44 and my position was at 144,46 . First when i took it i put tp at 143,96 ( 50 pips ) . Then you scared me
You warned me . Good that it took my way and not the either way ^^ Looking to go long with the prevailing trend
{quote} When you wrote this post I put TP at 144.44 and my position was at 144,46 . First when i took it i put tp at 143,96 ( 50 pips ) . Then you scared me You warned me . Good that it took my way and not the either way ^^ Looking to go long with the prevailing trend
Ignored
Hi Purec,
Quite often after a big move, like yesterday, there can be an immediate reaction in the opposite direction.
But there is no way of knowing this for sure though, so it's better to stay away and wait for a Pullback and wait for PA at Support/Resistance to take a trade with the prevailing trend.
{quote} Hi Purec, Quite often after a big move, like yesterday, there can be an immediate reaction in the opposite direction. But there is no way of knowing this for sure though, so it's better to stay away and wait for a Pullback and wait for PA at Support/Resistance to take a trade with the prevailing trend.
Ignored
Very sound advice. Never try and pick tops and bottoms.
Joined Dec 2010
|
Status: Never Stop Learning
|5,972 Posts
A lot of what I'm showing here I've learnt from different threads, on FF, it's only by discovering the information out there that you can work out the type of trader you want to be.
It's important to find the type of trader you are and what you feel comfortable trading.
Day Trader - Scalper - Swing Trader - Position Trader etc.
By a process of elimination I've discovered that I prefer trading Price Action, using as few indicators as possible, on the Higher TFs.
By knowing this I can eliminate any thread that's not concentrating on what I'm interested in.
It's important to do this other wise you can be like a kid in a sweet shop jumping from one thing to another.
I've got nothing to do with them commercially and don't pay for, any of, their paid content but there's a wealth of "free" information available for anyone prepared to look for it.
The threads and website I've highlighted are not going to be any good, at all, if you want to be a Scalper or trade the M5 or M15 TF that's what you've got to find out for yourself and you can only do that by looking.
I know Strat comes in for some stick because he's a commercial member, some of which he does bring on himself, but I've always found him to be very helpful.
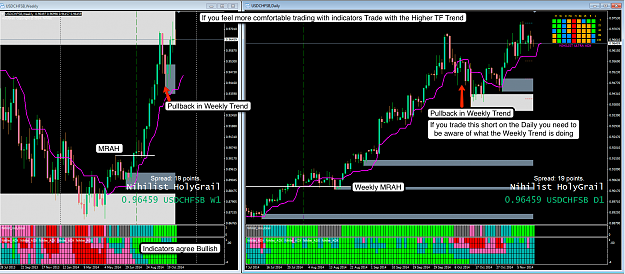
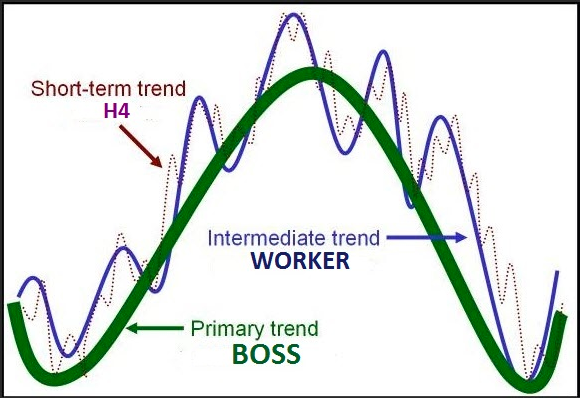
The image below is my favourite Trading Image it shows exactly what I'm trying to do.
Pullbacks in the Primary (Weekly) Trend that are then Traded on the (Daily) Intermediate Time Frame
A lot of what I'm showing here I've learnt from different threads, on FF, it's only by discovering the information out there that you can work out the type of trader you want to be. It's important to find the type of trader you are and what you feel comfortable trading. Day Trader - Scalper - Swing Trader - Position Trader etc. By a process of elimination I've discovered that I prefer trading Price Action, using as few indicators as possible, on the Higher TFs. By knowing this I can eliminate any thread that's not concentrating on what I'm interested...
Ignored
Steve you deserve a clap!! This tread is my new book! Cant put it down, so to speak!!
{quote} Hi mara, It's no good making predictions without something to back it up. It's going to take big shift in market dynamics to turn this pair, or any JPY pair, bearish. This pair might well be showing "over bought" on every "over bought" indicator ever developed. There is no "over bought", only the market can decide when it's had enough and the JPY becomes too cheap to sell. {image}
Ignored
Dear stevepatt I told you 16 H ago time is changet GBP/JPY short