{quote} thanks for your answer , i tried the version which was modified by you and i think there was something wrong with my EA because the red line was not fixed and it was moving with price candles!
Ignored
Hi kasrafx, that's because any time there is a new wormholes the line moves.
I don't like it and I'll fix. But remember the EA purpose is to show where and when the last wormhole appeared. Nothing more...
sym hi! i think i got a signal. what is next? is it buy or sell?thanks! {image}
Ignored
Hi mario777
I'm not the owner of the thread, you should ask to MetaCoder.
But before you need to read the original thread (292 pages) in order to have a picture of the system.
There is not shortcut, only work.
when you say 50 above or below you mean 5 pips or 50 pips. I mean my broker is 5 digit.
for example if the delta rate is 1.2560 I am going to sell at 1.2565 or 1.2610??
when you say 50 above or below you mean 5 pips or 50 pips. I mean my broker is 5 digit. for example if the delta rate is 1.2560 I am going to sell at 1.2565 or 1.2610?? Thank you
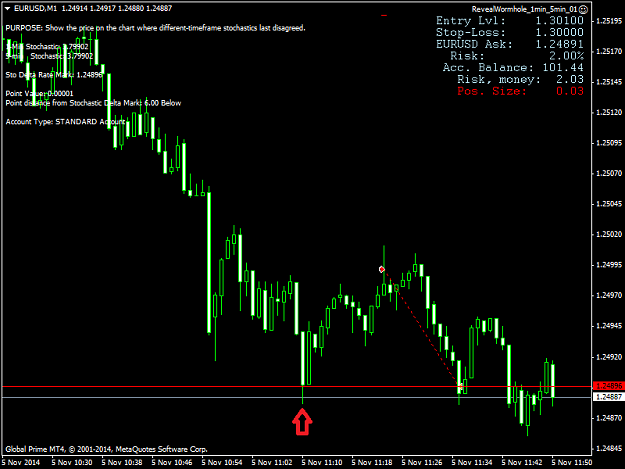
Thanks Metacoder for sharing this interesting tool. I understand that the EA should clean the red line once similarity is back. On the following example, wormhole appeared on the red arrow. I took a sell trade on round number and closed at TP. However, the red line is still in place. Is that normal ? FYI, I use the following EA on EU 1m chart: RevealWormhole_1min_5min_01.mq4 . Thanks.
|
Joined Nov 2012
|
Status: No Impact Member (bottom 1%)
|740 Posts
Edit: in essence same question as Fbird..
Once a wormhole has formed and price goes above it, reverses and clears the wormhole and goes under. Is the wormhole still valid to trade to? Or once cleared: wormhole closed?
I understand that the EA should clean the red line once similarity is back. On the following example, wormhole appeared on the red arrow. I took a sell trade on round number and closed at TP. However, the red line is still in place. Is that normal ?
Ignored
If the EA erased the red line when similarity comes back, we would not easily see at what price level the last wormhole occurred. The whole point is to see where the last wormhole was. When a new wormhole appears, the old one is erased and a new red line is drawn.
I do not think there is anything magic about the wormholes. In fact, I don't have a good idea of how often market action returns to them. I have only observed for a short time. Based on a tiny amount of observation, it seems that the market often returns to the most recent wormhole. But it does not always. It is up to you what to do as far as managing trade entries/exits.
This is a really good way to exploit the market. It isn't actually a wormhole, it's a supply-demand concept, which appears to happen very often in the forex market. When a cluster is formed on a higher timeframe, the middle works as a support-resistance for future reference. This, combined with RSI and keeping an eye on higher TF's trendlines, it's very profitable. If you spend some time examining where the horizontal lines are placed, you'll see what I'm talking about. Most of the time such a cluster happens when (for example) there was a sudden, huge move on a higher TF, which directed the price very far away from its original trendline. When a supply/demand zone is reached, the price starts ranging in such clusters until the trendline rejects the price (or gets broken, of course).
P.S. the clusters I was talking about are a few candles (2-3-4 or more) on a higher TF where a tight range occurs - the open of 1st candle is equal to the close of the second. The wicks of highs/lows aren't really important.
If you keep an eye on the news calendar, you can spot a breakout really easy, admit your mistake and jump on the train with the trend.
G/U right now is a clear example of a 'wormhole'. The price wanders around 1.60450 with a hard-top @ 1.61800 and diving down to 1.59200
Hi everyone.
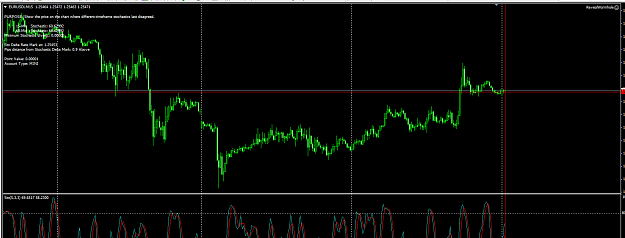
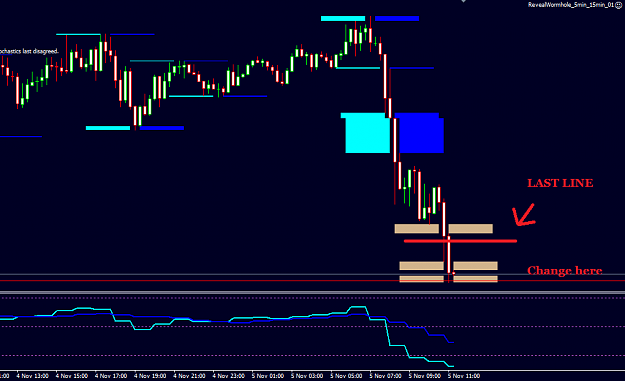
I propose you to check the next idea.
We need to have two wormholes. The price will go from second to first.
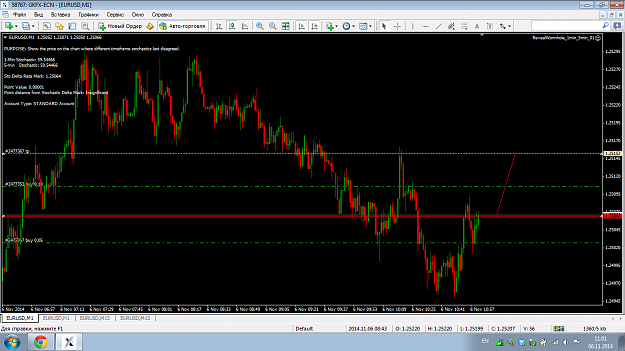
On the fist png. we have 1 wormhole.
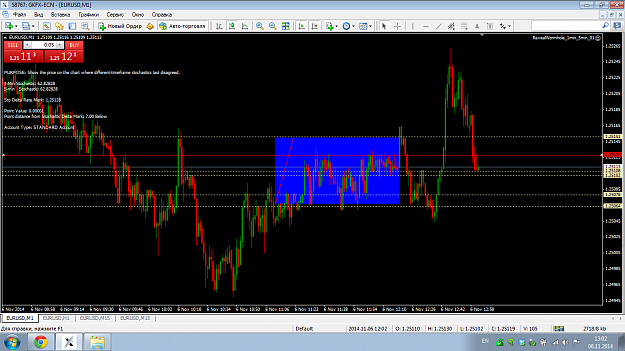
On the second png I mark the second wormhole. The price have to go from 2nd wormhole to 1st.
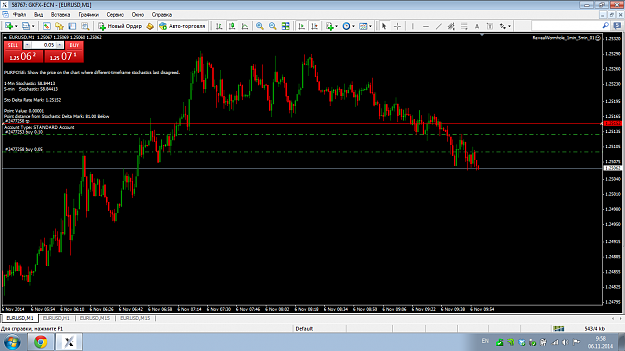
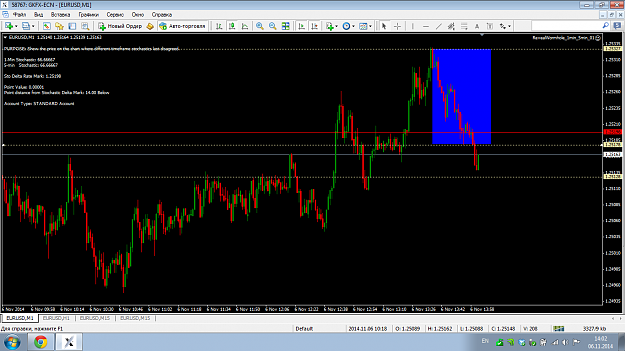
On the third png I mark the area of price movement.
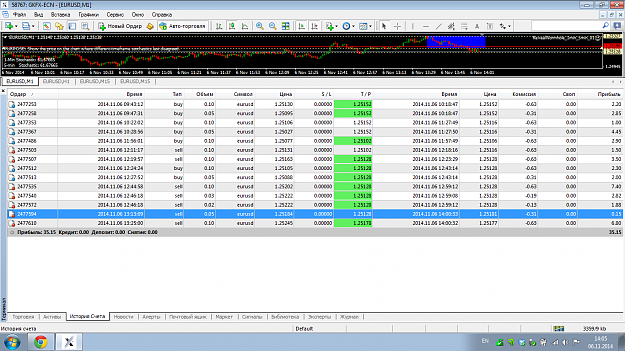
Thats my profit.
Hi everyone. I propose you to check the next idea. We need to have two wormholes. The price will go from second to first. On the fist png. we have 1 wormhole. On the second png I mark the second wormhole. The price have to go from 2nd wormhole to 1st. On the third png I mark the area of price movement. Thats my profit. {image} {image} {image}
Ignored
Hmmmmm...Interesting Denmx...very interesting.
I will investigate this further.
[Great job MetaCoder! This caused a BRIGHT LIGHT BULB to come on inside my Skull...am up to 15+% banked playing around with this in a Demo account. Ideas, ideas, ideas! Thanks.]
Hi everyone. I propose you to check the next idea. We need to have two wormholes. The price will go from second to first. On the fist png. we have 1 wormhole. On the second png I mark the second wormhole. The price have to go from 2nd wormhole to 1st. On the third png I mark the area of price movement. Thats my profit. {image} {image} {image}
Ignored
Can I ask you a simple question - I assume you know what's support & resistance - can you please tell me the difference between S&R plotted on the chart, based on old information, and the wormholes you are trading?
Hi everyone. I propose you to check the next idea. We need to have two wormholes. The price will go from second to first. On the fist png. we have 1 wormhole. On the second png I mark the second wormhole. The price have to go from 2nd wormhole to 1st. On the third png I mark the area of price movement. Thats my profit. {image} {image} {image}
Ignored
The first wormhole is already cleared as the second is made.
Not about how much you win, but how much you loose
{quote} Can I ask you a simple question - I assume you know what's support & resistance - can you please tell me the difference between S&R plotted on the chart, based on old information, and the wormholes you are trading?
Ignored
I know about trading alot of things, and of course about R&S lines too.
But all lines on the png which I attached are the wormhols. I just marked their on the chart and trade from one to another.
It's one of my idea about using the wormhales EA.