DislikedThank you...
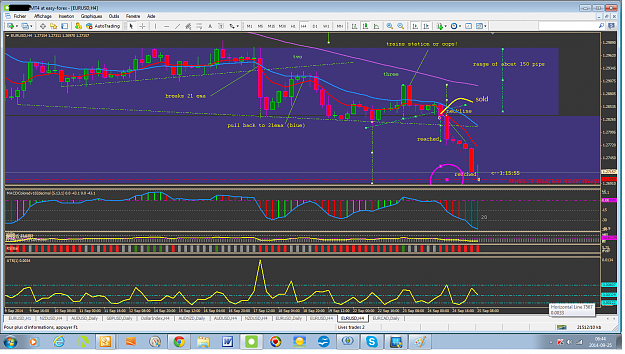
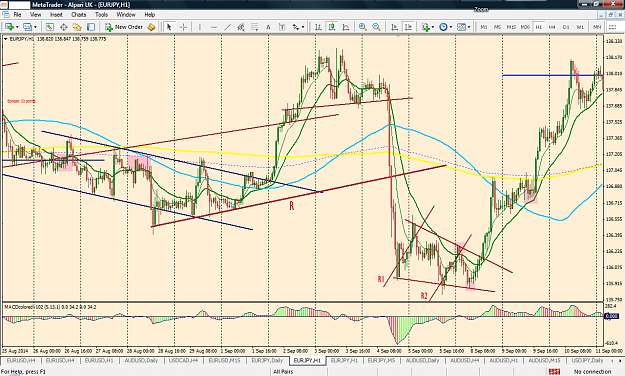
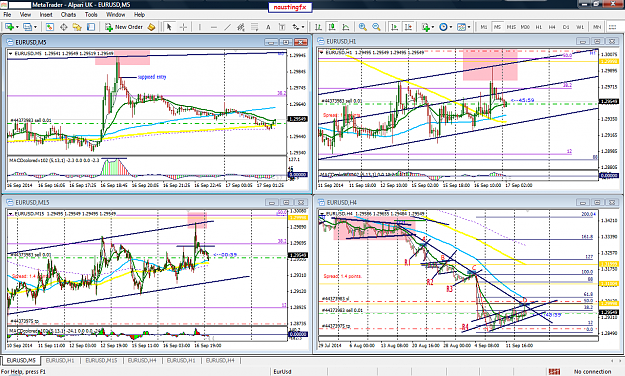
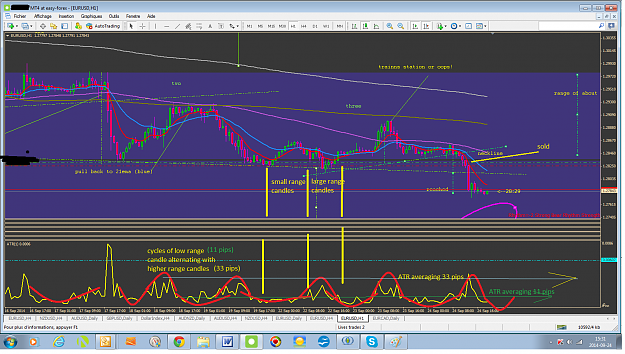
And if it comes to the ATR(1) I'm really not sure how to use it. What i got was that if the course is a side phase where it's not sure if the trend is going to continue or it's going to give a turnaround, the ATR (1) tends to be pretty low. But i don't know how to interpret the spikes and the "little" spikes which tend to go a bit high but then don't go skyhigh like the other ones i marked (grey circles). My Chart is a bit different from yours, i hope that's not confusing. best regards {image}Ignored
The ATR:
If all candles would be equal,(I haven’t seen that yet!) I mean by that same range. As example: all candles have a lows of 1.3000 and the highs are all the same at 1.3010 and the closes are all at the same level,(just like brand new wax candles standing up on a kitchen table) then the ATR (set at 1) wouldn’t have any “sparks”. You would see a horizontal line only, no spikes at all.
If one candle has, a higher range among them, then the ATR(1) result would be a horizontal line with only one “spike” in it.
If that higher range candle is repeated at every 5 low candles, then it is easy to see a cycle. So if the fifth (small) candles just closed so it would be easy to predict that the next candle should have a higher range. So from cycle there is Anticipation to extract from it. And with anticipation one could plan a winning trade there.
This is why by looking at ATR set at 1 has many advantages, among them is to look for cycle in spikes, as well as giving the trader an idea where to expect the range of the coming candle! If so, then the evaluation of where to put the stop loss ( in trouble time!) in a safer place would temper the emotion in trading.
By the way expect that after a bunch of small range candles a large range of candles follows.---it is a cycle too!
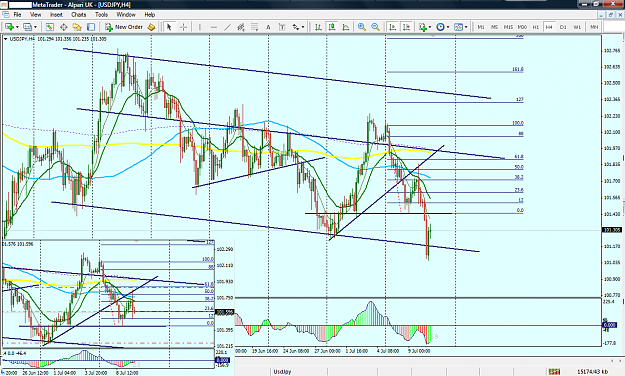
Attached Image (click to enlarge)
Yvon