DislikedAddo: Also, I would assume that trading back to the MAs gives a much higher probability of success in general. Do you trade when Price is between the MAs? Should I aim for the red one or the green one?Ignored
http://i62.tinypic.com/wrm0jp.jpg
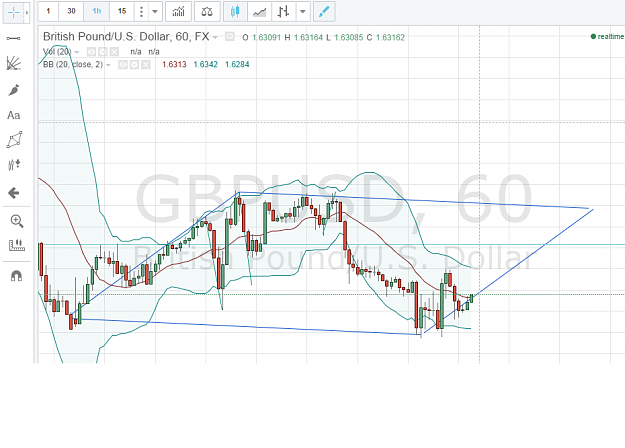
If you've been drawing the B2i correctly and using the Harmonic Fall Line along with the Standard (Neutral) Fall Line, then you would see where the "Real Price" zones sit in relation to everything else, including your long range market bias indicator. Here, you are seeing this take place on the H1 Chart. These are the same D1 B2i and that older one is now five days old with no strike. It came close two times in the profit range of over 100 pips, but then pulled back precisely in relation to your question.
Most of the other charts I've shown with OS1 have been on the M1 time frame. Of course, the bigger the time frame, the stronger the influence can be on price in lower time frames WHEN the Market Phase is 1 or 5. However, you have to make sure you are observing and evaluating the Market Phase in all relevant time frames. Doing that we find the following:
GBPUSD | D1 B2i on M30 Chart
http://i62.tinypic.com/5kr3af.jpg
My long range market bias indicator (OS1) has cross twice since the initial Early Warning Entry Window nearly five days ago. The OS1 condition was Flat at the time of what should have been the initial trade entry. It then crossed UP and has since crossed back DOWN over the course of four days.
GBPUSD | D1 B2i on M15 Chart
http://i62.tinypic.com/30dcm6w.jpg
Interestingly enough, OS1 on this chart was never crossed DOWN and continues to be in the UP condition with inverse angles on both the Green and Red lines. Meaning, the OS1 condition is UP (Green over Red) but both lines are angled down WHILE in the UP condition. This is a strong indication of high market volatility in this time frame which can been witnessed on the chart. It ALSO is an indication of the potential for an OS1 cross, in this case, to the upside.
GBPUSD | D1 B2i on M5 Chart
http://i60.tinypic.com/200qmuw.jpg
Zooming in on the M5 time frame, OS1 had three crosses since the establishment of the five day old D1 B2i of 9/19/2014. At the Early Entry Window into the Long position, M5 OS1 had just crossed to the DOWN side. That was reversed one day later with price behavior and OS1 reversed to the UP side and remained there for two days until price reversed it again to the DOWN side on the slight failure to reach the D1 B2i Standard Fall Line of 9/19/2014. OS1 is now DOWN side and you should not that its lines are widely separated. This indicates price exhaustion to the DOWN side in THAT time frame. You should also note how this OS1 DOWN side price exhaustion is perfectly lined-up with the current D1 Inverse B2i Structure.
That D1 Inverse B2i Structure is also lined-up with the 9/16/2014 D1 Standard B2i Early Entry Window. What you are witnessing (at this point) is a Double Bottom being formed on the M5 time frame before all OS1 conditions go to UP.
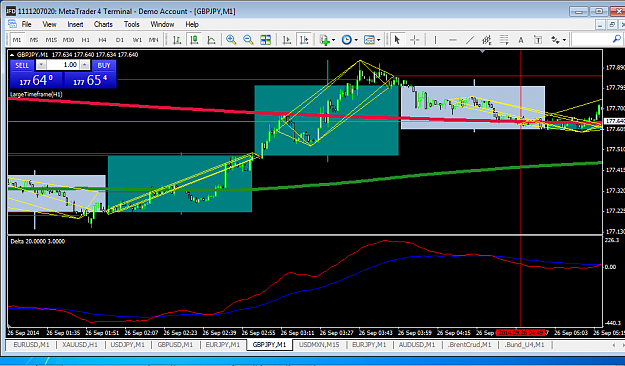
GBPUSD | D1 B2i on M1 Chart
http://i61.tinypic.com/2eo9xdl.jpg
Finally, at the M1 level we see the current D1 Inverse B2i Structure up close and personal with detailed price behavior inside the inverse structure. Remember, these Inverse structures are historically known to repel price in the opposite direction of the Fall Line. That would place the repelling action directly in-line with the original 9/19/2014 Early Entry Window back to the Long side.
So, if nearly 100 pips was not enough for one to exit with profit two to three days ago, then you are still in the Draw Phase of this Hold. However, by having some detailed information about the "structure of price" in multiple relevant time frames, you can see the potential for continuing the Hold on this trade back to the upside (I am not tracking news on GBPUSD, so keep track of that yourself - news trumps all indicators and all trading systems that are contrary to its own vector).
What I'd be looking for here, is a consistently and stable crossing on the OS1 to the upside. The current price behavior around the M1 OS1 region is indicative of such a cross looming. Other factors are obviously at play, but this is about the extent that I can demonstrate this for you using just one silly little indicator (and of course, OS1 as the stabilizer).
So, I hope that answers your question. Yes, you can trade these structures when they are in the midst of OS1, but you need to analyze the relevant time frames and keep track of all the forthcoming Standard B2i in the time frame you have selected to trade (all other relevant time frames as well, if you want maximum input for decision making purposes).
F-X-C-M | A Classic Retail Bucket Shop Scam Artist Who Manipulates Prices