DislikedConfused. I like to trade in 5 min chart as you stated, the reason being 1 min is too noicy. If it is 5 min chart, trading, CCI 14, CCI 70, CCI 210 would be required or not ? This is equivalent to : I see 1 min, 5 min, 15 min CCI in 5 min chart. Am I right ?Ignored
I think your avatar says it all right now, doesn't it????
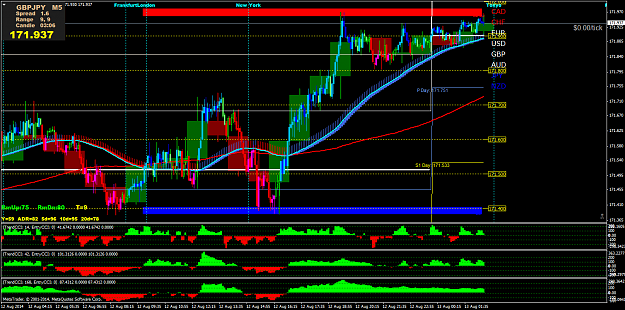
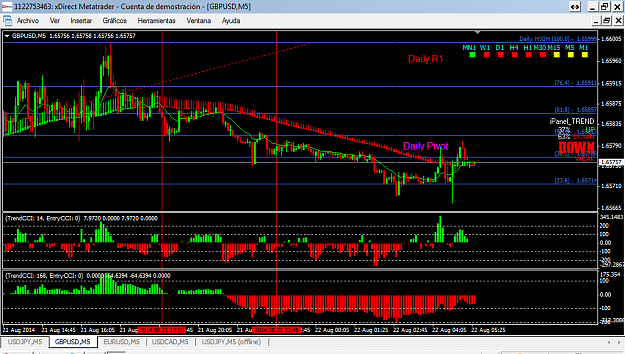
To answer your question if you want to trade the 5 min as your base chart and use the 14 as your base CCI period then all you need to do is times your base CCI 14 by whichever timeframe you want above. Eg if you want the 15 min then as theres 3x5 mins in a 15 min period its 14x3=42.
If you want the 60min CCI on your 5 min chart then as theres 12 periods of 5 mins in an hour its 14X12=168.
So for a 5 min chart set the 3 CCI's as 14,42 and 168. That means you will be looking at the 14 period CCI for the 5 min , 15min and 1hr timeframe on your 5 min chart.
Hope that makes sense???
The idea behind the strategy is to trade the 5 min chart in the direction of the higher timeframe momentum so that means when the 1 hr CCI (168) is moving from oversold to over bought you should be taking only 5 min over sold buy signals from your 5 min CCI(14).
A buy signal is when the cci crosses from below -100 to above and a sell signal is when the cci moves from above +100 to below. Basically above +100 is overbought and below -100 is oversold. The great thing about the CCI as a momentum indicator is that it has no limits to its overbought or oversold states, they just get bigger and bigger. Thats why I use it as oppose to other momentum indicators that have a roof and floor to their overbought and sold levels.
As I explained earlier I am keen to see a very oversold or bought market on the higher CCI give us a sell or buy signal then look to take the next 2 lower timeframe CCI signals in the same direction as tighter stops so less risk but the same upwards rewards so bigger RR's.
And that my friend, bigger RR's, to me is the secret of a successful trader. Bigger winners than your losers a lot bigger if we get it right.
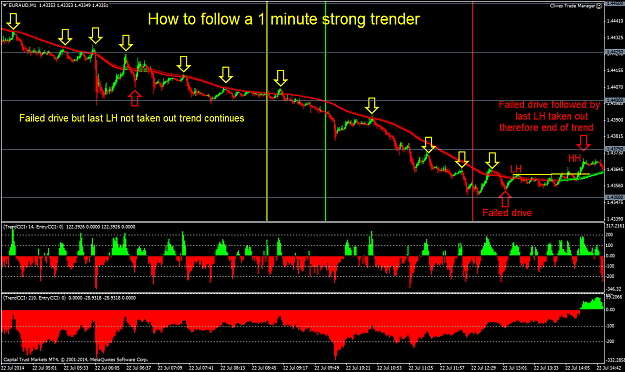
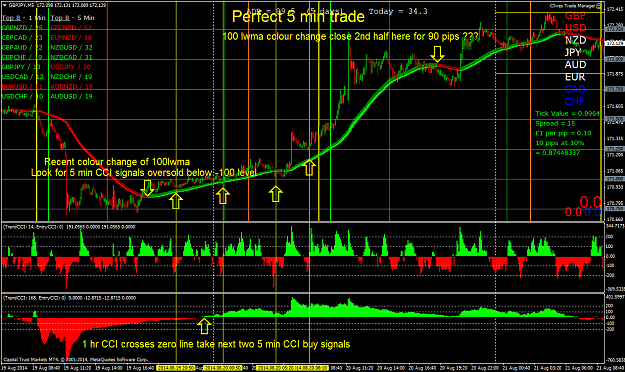
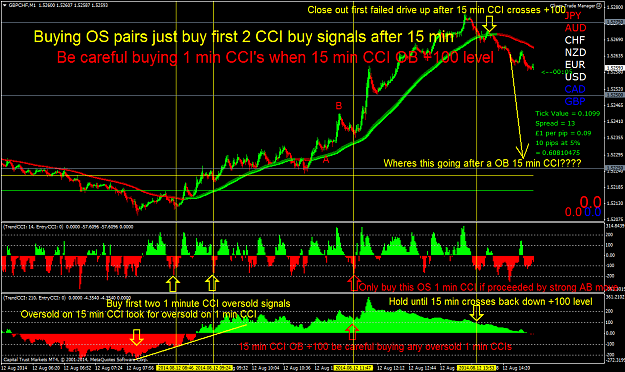
In the simplest language I can put it when I trade the 1 min chart I am looking for the 15 min to go very oversold then give me a buy signal, crosses up from below -100 level, then look for the first oversold signal on the 1 min and buy it. Usually the first 2 signals are the best eg Elliot wave 3 and 5.
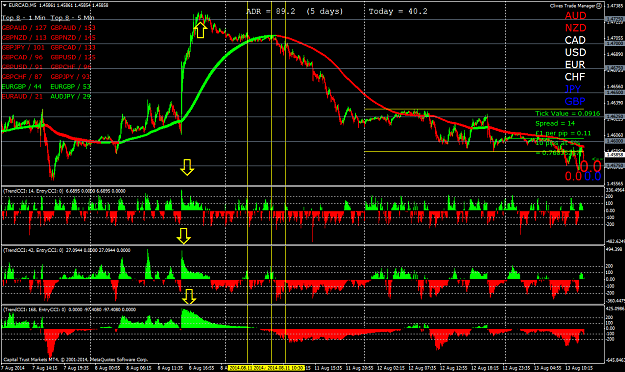
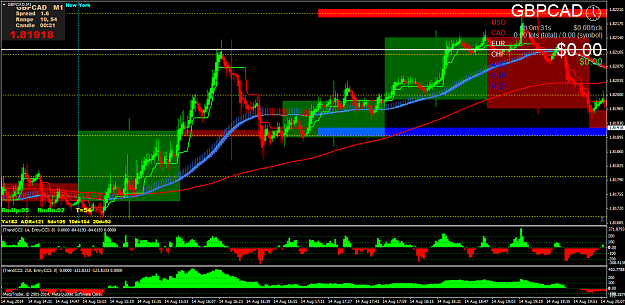
Heres a chart of GBPCHF from earlier today showing exactly what I'm talking about. notice the market structure confirming the reversal, thats very important don't just buy everytime the 15 min goes over sold. You have to wait for the market structure on the 1 min to confirm the turn.
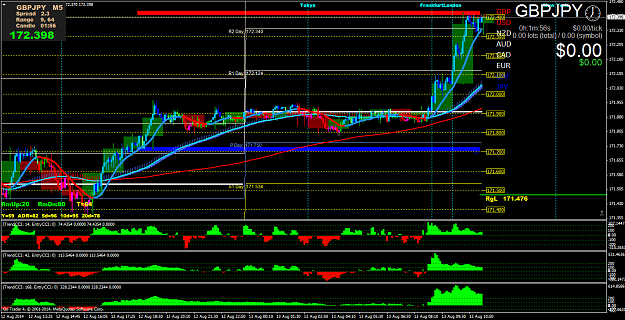
If you want to trade the same setup on the 5 min then I would look for the 1 hr CCI (168) to give you a buy or sell signal then take the next 2 on your 5 min CCI.
One word of warning once your 1 hr goes overbought with the new trend be careful taking any more 5 min CCI buy signals as upside 70% of the time could be limited but I have taken them if they are preceded by a strong move up AB leg in front of the pullback BC leg.
Hope thats helped...
Attached Image (click to enlarge)
Feel the Fear and do it anyway!!!