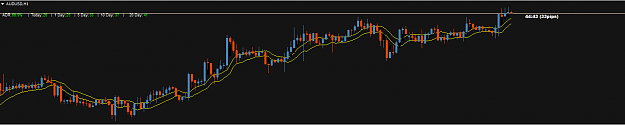
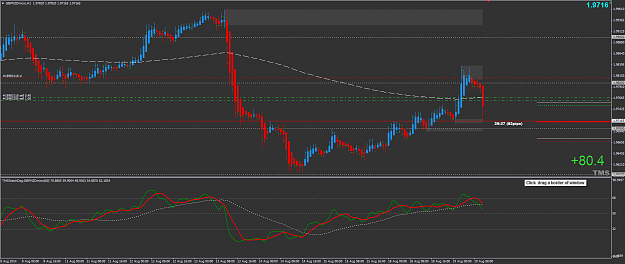
Yes as we planned, but I was too busy with GJ trade long since LO, and didn't go well, totally missed that trade, so might be another sell off left on the table, will see if I get to trade the retracement back to downside
I Have Learned to Take Some Losses to Make Profits
{quote} Yes as we planned, but I was too busy with GJ trade long since LO, and didn't go well, totally missed that trade, so might be another sell off left on the table, will see if I get to trade the retracement back to downside
Ignored
Yes indeed...it worked...Did you close your GJ long?...i was not paying attention...Monday slow market...
hi, TMS traders: Kind of an odd request, but is there any coder out there who can separate the price action channel (PAC) from the 'synergy pro APB' indicator? I know the PAC are 5smma applied to high and low, but no matter how I adjust the shift they're never the same with dean Malone's original PAC. I have attached the APB with PAC on it. And I need a stand-alone PAC indicator if possible. Any help appreciated! Shuo {file}
{quote} hi lastingwell, Went to the journal tab and everything is loaded successfully
Ignored
If there are no errors at all, its difficult to know what can be using up the memory enough to slow down the platform. What you could do is get up a fresh chart and put the indicators onto it one by one with the settings you have, so it matches the other chart, then save that as a template and see if it loads faster, there maybe something else on the template thats not showing up as an error but very slow to load. If it loads fast with no problems, just use the new one. Thats the only thing I can think of that might help.
hi, lastingwell. thx for your reply. But I want the PAC only. I tried 5smma high and low but they never really fit with the original ones. Do you, or any other trader, know how I can get ONLY THE PAC from the original synergy indicator? THX.
{quote} hi, lastingwell. thx for your reply. But I want the PAC only. I tried 5smma high and low but they never really fit with the original ones. Do you, or any other trader, know how I can get ONLY THE PAC from the original synergy indicator? THX. SHUO
Ignored
Oh sorry I thought you wanted the bars not the PAC Unless someone has mentioned what the PAC settings are for that indicator I'm afraid as its an ex4 file it will be difficult to get, the settings mentioned before in the thread dont match up to that one. If you can't find mention of the settings anywhere the only thing I can think to do is to either try different settings yourself with a moving average or another workround until you find the settings is to go to the colours tab of the indicator and change everything apart from the yellow colour to none and then go to the chart properties and click on chart on foreground, that seems to work ok.
{quote} Oh sorry I thought you wanted the bars not the PAC Unless someone has mentioned what the PAC settings are for that indicator I'm afraid as its an ex4 file it will be difficult to get, the settings mentioned before in the thread dont match up to that one. If you can't find mention of the settings anywhere the only thing I can think to do is to either try different settings yourself with a moving average or another workround until you find the settings is to go to the colours tab of the indicator and change everything apart from the yellow...
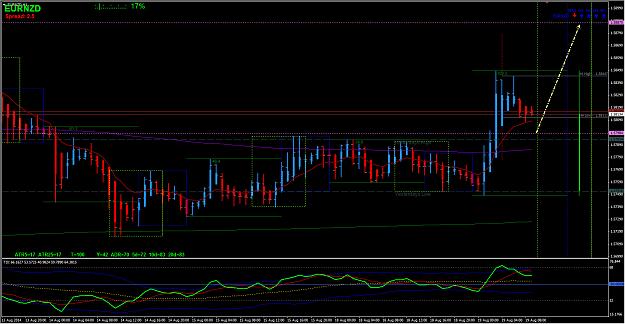
EUR/NZD looks interesting, I was following that pair since yesterday looking to buy, but was not sure from which level, or what time of the day, apparently the moved started when am slept, so now am looking to buy on the retracement back to structure going for RN , even tho I don't have this pair as a trading pair on my trading plan, but just looking, I might take it I might not, just an opportunity am watching for the day
Attached Image (click to enlarge)
I Have Learned to Take Some Losses to Make Profits
EUR/NZD looks interesting, I was following that pair since yesterday looking to buy, but was not sure from which level, or what time of the day, apparently the moved started when am slept, so now am looking to buy on the retracement back to structure going for RN , even tho I don't have this pair as a trading pair on my trading plan, but just looking, I might take it I might not, just an opportunity am watching for the day {image}
Ignored
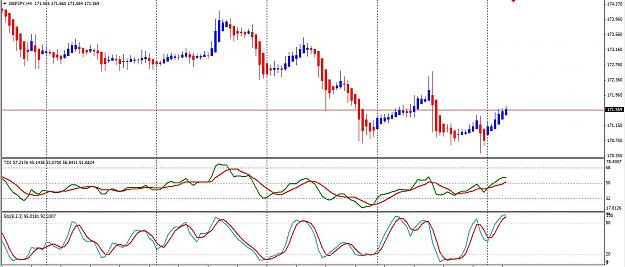
The lavender dotted lines are an indicator or just something u have plotted to show us entry and exit.
EUR/NZD looks interesting, I was following that pair since yesterday looking to buy, but was not sure from which level, or what time of the day, apparently the moved started when am slept, so now am looking to buy on the retracement back to structure going for RN , even tho I don't have this pair as a trading pair on my trading plan, but just looking, I might take it I might not, just an opportunity am watching for the day {image}
Ignored
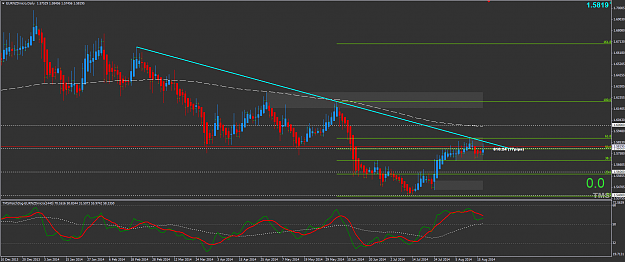
PA is the question...scalping may be ok...Near the trend line...fib 68%...But i am more in to short this pair....looking for a good PA...
{quote} PA is the question...scalping may be ok...Near the trend line...fib 68%...But i am more in to short this pair....looking for a good PA... Just my thought.... {image}
Ignored
yes and in so am waiting a more confirmation H4 TDI bounce which is still not there, so will wait and see
I Have Learned to Take Some Losses to Make Profits
{quote} PAC is 5 Smoothed high and 5 Smoothed low, BR
Ignored
Yes I know whats been said on the thread but if you put the synergy pro indicator on the chart as he did it includes the PAC if you then put another moving average on the chart with the settings you have said and has been said all along on the thread, they don't match up at all.
{quote} Hello Shaan. That is called a "Price Action Channel" Try to keep your charts as simple as possible. See my chart below: {image}
Ignored
Hello mastersm and thanks for the reply lastingwell and masterm .I am testing this strategy now on demo and its going great for me and i am keeping it
simple.