|
Commercial Member
|
Joined Sep 2012
|3,282 Posts
Safrash, you are making the typical mistake which everyone was making or still is making.
It is nothing wrong with you, it is a natural human reaction.
You are reacting upon the sudden movement of price in a certain direction.
At the same moment, your mind stops thinking, it gets blocked.
This is also a natural physiological reaction of our mind.
You stop seeing the larger picture and forget that price is at resistance.
This is also a typical action of the price, something called Fake Head.
It takes a lot of time to get rid of this instinct, and a lot of mental work.
The first step is to be aware that there is nothing wrong with you.
It is natural, it happens every time we are under pressure or stress.
It is about the communication of our internal organs with the brain.
The brain receives a lot of different data from all of oue body.
In this case it is the signals sent by our heart.
Our heart is the most powerful organ in electric signals terms.
In the situation of pressure it sent a whole lot of chaotic signals to the brain.
The brain shuts off. It is a natural primitive defense mechanism.
There are methods to help you in such situations.
This is not the thread to teach you how to manage stress.
But, there are some useful video links in my thread.
You will get to them as you read on.
{quote} My respects Master what is indicator on down left of chart? and how you did you candles by this color?
Ignored
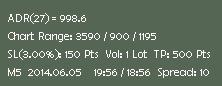
If you look closely, you will see:
Attached Image
Bottom: Timeframe, date, broker time / local time, spread
Second: Lot volume calculator
Third: Indicator for setting chart offsets from top and bottom with today's range
Fourth: Simple Average Daily Range indicator
Like I told you before, I learned to do some programming in MQL4.
So, I can create simple indicators, scripts and EA's.
I don't understand your confusion.
Your computer can process as many colors as your graphic card can handle.
You will see as many colors as your monitor can show you.
That is, if you are not a color-blind person.
You can set your chart colors to any color you wish.
MT4 uses the standard color pallette that windows offers you.
Which also means that you can define any color you wish.
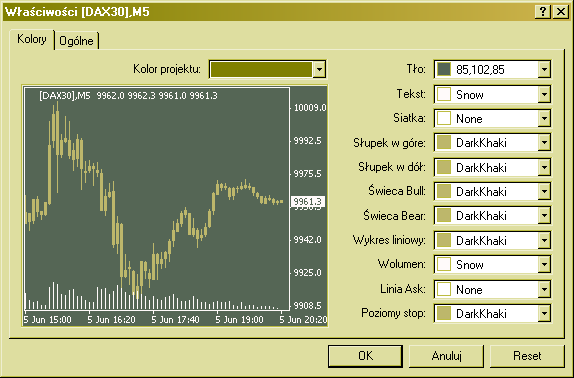
Yes, by default you can have 2 different candlestick colors
and 2 different bar colors, and 1 line chart color:
Attached Image
It is not a difficult job to create a simple indicator which will plot a small line
the length and width of the candle body under some condition(s), and define colors for each case.
But, it takes time and practise to learn to do it.
Not to mention the knowledge you must have to know what you want to see.
Safrash, you are making the typical mistake which everyone was making or still is making. It is nothing wrong with you, it is a natural human reaction. You are reacting upon the sudden movement of price in a certain direction. At the same moment, your mind stops thinking, it gets blocked. This is also a natural physiological reaction of our mind. You stop seeing the larger picture and forget that price is at resistance. This is also a typical action of the price, something called Fake Head. It takes a lot of time to get rid of this instinct, and...
Ignored
Bravo master, you as always on top, not only give lessons Forex, but also can calm the student, it lacks many teachers. Yes indeed, human psychology is complex, the balance comes from experience, a lot of unexpected encounters beginner and overcomes his fear, but with experience everything will fall into place. Thank you very much
{quote} Bravo master, you as always on top, not only give lessons Forex, but also can calm the student, it lacks many teachers. Yes indeed, human psychology is complex, the balance comes from experience, a lot of unexpected encounters beginner and overcomes his fear, but with experience everything will fall into place. Thank you very much
Ignored
You misunderstand me! Not PSYCHOLOGY! PHYSIOLOGY!
It has nothing to do with psychology.
It is about basic physiology of our body.
If I tell you: "Don't worry! Be happy!" you have no reason to believe me and no reason to change your behaviour.
Because in order to get better results, you must change the behaviour which causes the bad results.
You can only do that if you change your thinking about what you are doing.
You can only change your thinking when you change your feelings about what you are doing.
You can only change your feelings when you change your emotions about what you are doing.
Emotions are generated by the signals your body is sending to your brain.
So, in order to change your emotions, you must regulate the signals that go to your brain.
Chaotic signals cause brain block and you can't think clearly about your emotions.
You may not even realise what your emotions are, normally.
So, in order to regulate your signals, you must use some technic, like regular pace breathing.
This is at the most basic level of our body - physiology!
None, I just pointed out for clear interpretation, but I don't know your way of interpretation.
It seems very strange, or rather alien, or exotic to me.
Well, not really, I know some people of Islamic traditions.
You have problems with being real, true.
You think that hiding something from others is the way to be.
I am not that way.
I am straightforward, and I don't look for the second or third bottom.
{quote} If you look closely, you will see: {image} Bottom: Timeframe, date, broker time / local time, spread Second: Lot volume calculator Third: Indicator for setting chart offsets from top and bottom with today's range Fourth: Simple Average Daily Range indicator Like I told you before, I learned to do some programming in MQL4. So, I can create simple indicators, scripts and EA's.
Ignored
Nice, but you did not represent it in forum for us, don't want?
{quote} Nice, but you did not represent it in forum for us, don't want?
Ignored
You ask too much.
Try to do it yourself.
Don't think I am here to give you everything and you only take advantage of it.
I have given out for free knowledge which some people could have turned into millions by now.
Nobody has given me back anything, yet.
Hello Dadas
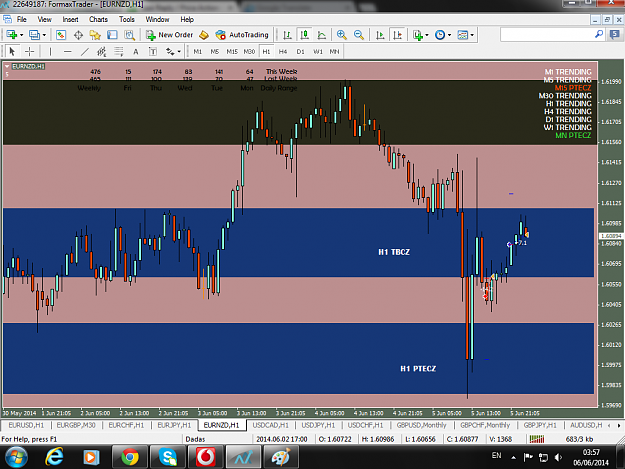
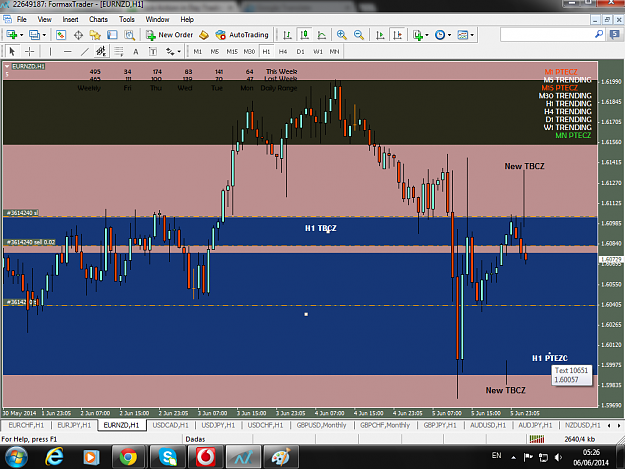
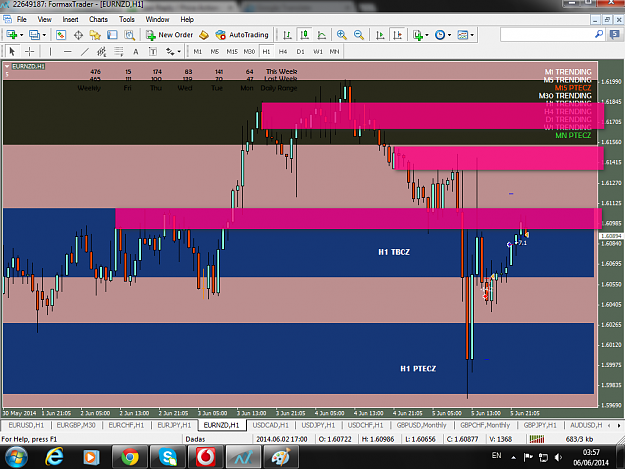
I'm watching that the Price Action requires finding new Zone in which I trade and it is must be desirable that last Zone in tradable TF. This is chart entered Long in 21:17, H1 TBCZ was plotted on old candle, profit +7 pips, order closed by opposite candle, SL can trailed on order price.
Hello Dadas I'm watching that the Price Action requires finding new Zone in which I trade and it is must be desirable that last Zone in tradable TF. This is chart entered Long in 21:17, H1 TBCZ was plotted on old candle, profit +7 pips, order closed by opposite candle, SL can trailed on order price. {image}
Ignored
Safrash, get your act together!
What are you trading, huh?
If you are trading the H1 PTECZ and CSCZ method, then trade it, not your own ideas!!!