DislikedHi, Clive! if I use 5 and 15 TF what CCI period can I use? 14 and 42? or other ThanksIgnored
If you like using the 14 period on your base chart then just times it by the timeframe you want above it. EG 14 x 5 = 70.
But to be honest I find it works best when you maintain an approx ratio of 15 to 1 between the time frames so I recommend as follows for each timeframe:
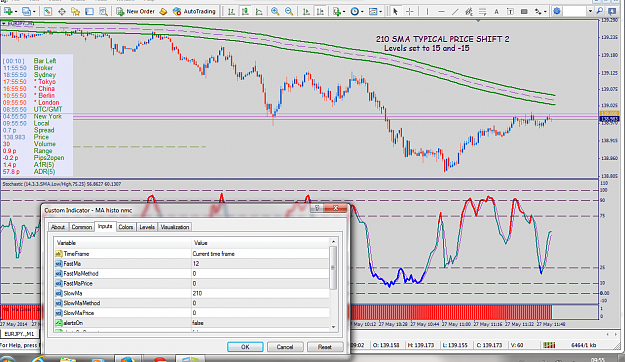
trading 1 min use 15 min as master (14 and 210)
trading 5 min use 1hr as master (14 and 168)
trading 15 min use 4hr as master (14 and 224)
trading 1hr use daily as master (14 and 336)
trading 4hr use weekly as master ( 14 and 504)
trading daily use monthly as master (14 and 350)
Its not an exact science but the logic behind it is that the momentum runs on say a daily chart are a down trend on the hrly chart so if daily pair falling off the page then sell the pullbacks(-100 CCI signals) on the hrly chart.
The single most important thing though is that you identify a strong trend before trading any pair as you will find momentum indicators are fairly accurate in a strong trending pair. eg top of the top 8 trenders indy.
Then look at hrly chart and sell the pullbacks against the trend.Of course all trends come to an end at sometime so you are almost guaranteed a loser at the end but stop taking the hrly cci's when daily CCI crosses down from the -100 level as trend is weakening.
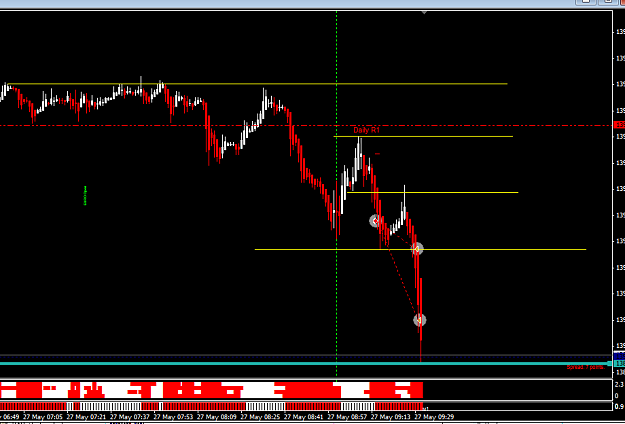
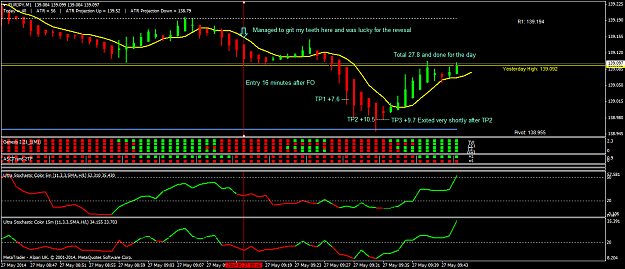
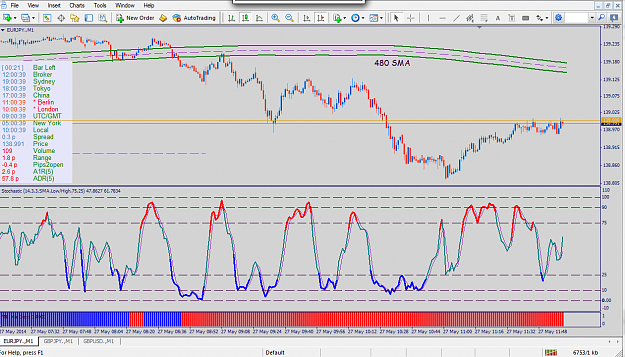
Its all about momentum for me, look at attached chart shows EURAUD as top of the daily trenders so sell every 100cci signal thats over 100 and either a double top or Lower High. Use HA candle colour change as confirmation for entry.
Anyway will shortly start my own thread on this system as starting to hog Roois thread and thats simply bad etiquette so will be moving on soon. Apologies Rooi.
Attached Image (click to enlarge)

Feel the Fear and do it anyway!!!