Disliked{quote} 1. Am I right to say, for example if it is ranging and it breaks higher, you would use the top two resistance areas? And if it is trending upwards, you would use the consolidation areas for your indicator? 2. Does your CCI have anything to do with it? Edit: 3. Could you update the link where we can download your indicator? I would like to play around with it Edit: 4. Sorry I was looking at your gold chart and I noticed you connected the left side to a bottom and the right side to a top, what type of situation...Ignored
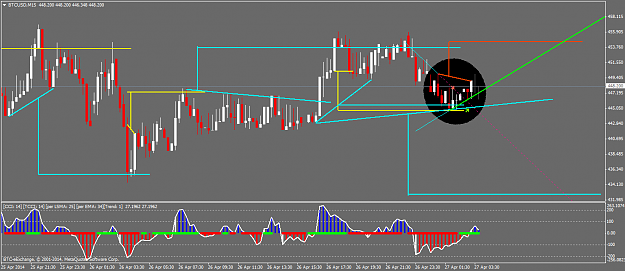
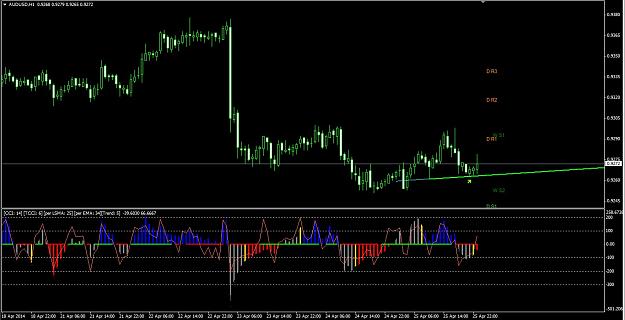
2. I have found the CCI the most accurate in warning of a trend change & break outs. Break outs especially on the 15 min chart.
3. http://www.forexfactory.com/search.php?searchid=9506047
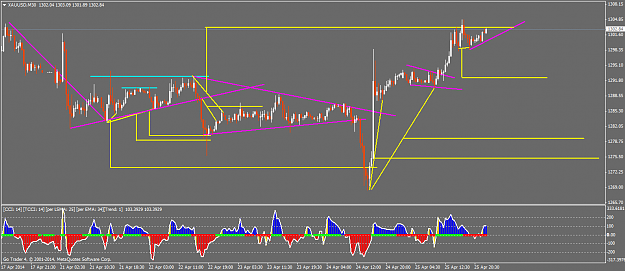
4. Unusual & understandably confusing for others like yourself. I got the right side point by drawing it on the 30 min chart & ticking the 30min, 1h & 4h Boxes to show the line on all 3 charts. The 30 min chart shows a clear support to draw to.
The fact that the line ended up on top of a 4h resistance point is coincidental, but shows how the drawn lines often end up as future support & resistance lines.
Shit Happens