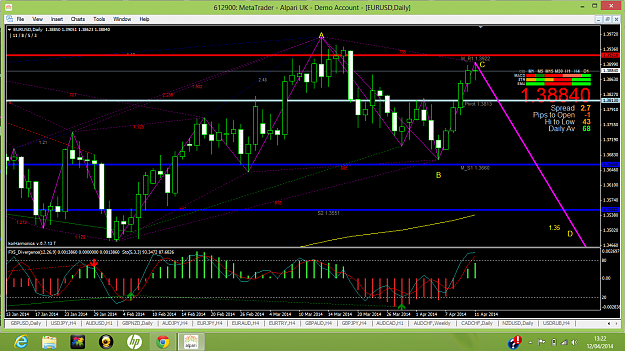
The pattern might not be the best I have traded, however the location and nature of the Fib numbers on both 4 hours and Daily chart led to believe this is a good risk/reward trade.
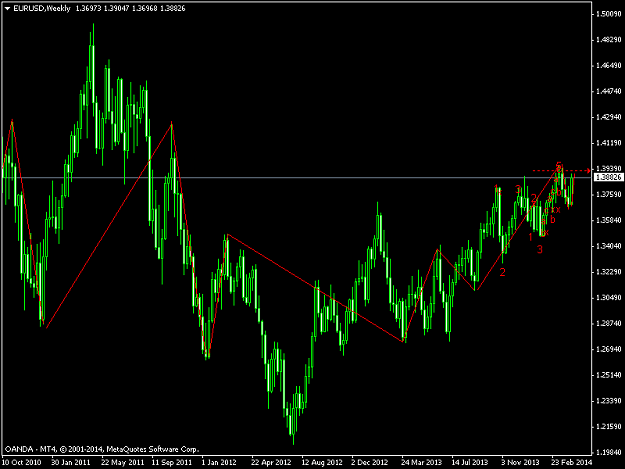
The way I see it, if we are close to a reversal (due to Butterfly Sell on weekly chart) and 61.8 major resistance Monthly chart, a 78.6 Retracement up on Daily chart would be just about enough for any bear market.
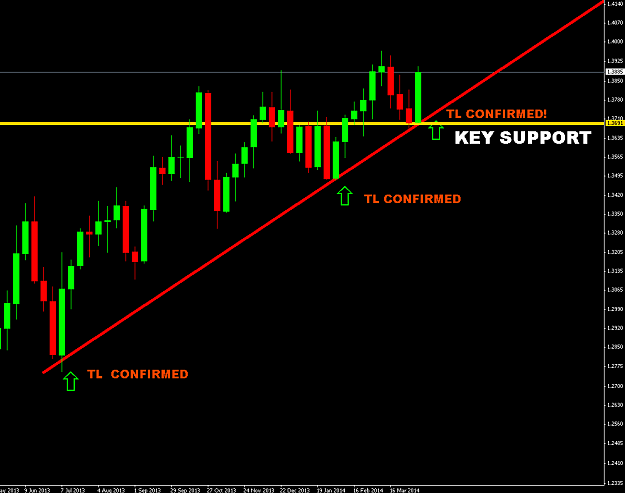
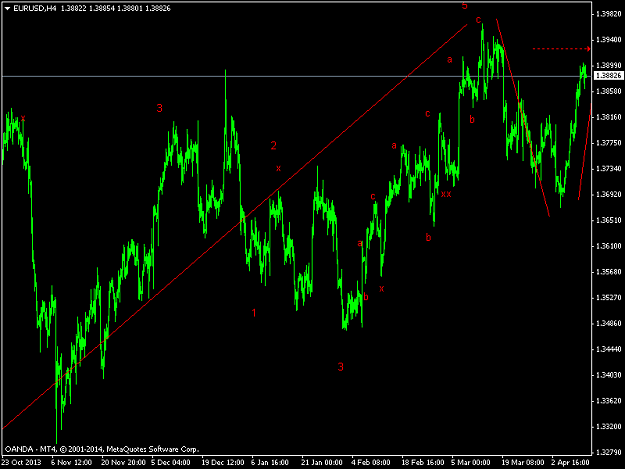
If this line becomes broken upwards then and only then I would be more inclined to consider completion of major ABCD on Monthly chart at 1.4205 (Yearly pivot Resistance 1) and 1.4400 within the same formation.
My trading plan for next week stands and ideally in the near future (2 weeks maybe) we would see this ABCD completion around 1.35 on Daily chart.
If not, I will take the loss and look for another setup, after all this is only a probabilities game.
Have a good weekend.
Attached Image (click to enlarge)
Fibonacci will make you rich