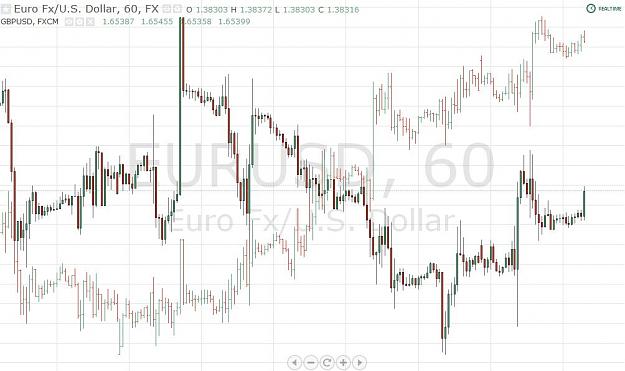
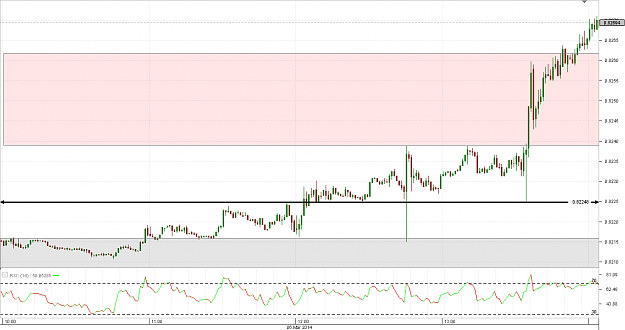
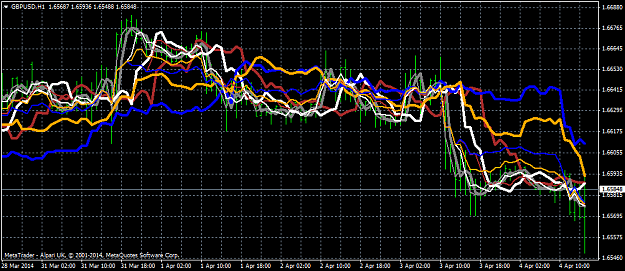
This overlay shows the possibility of the Euro being a bit undervalued against the Pound in the same way it was over valued on 24th March 18:00. It's an hourly chart
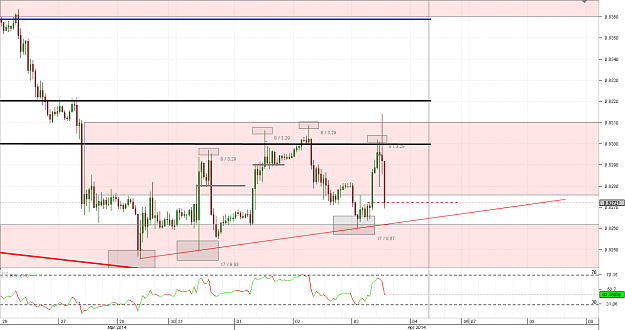
Still waiting for a deeper test into 240 - 200 before adding some new long positions. Took some small short positions for the day from 300 and managed to get some nice movement but have closed them out now and just waiting for lower level to enter long.
{quote} Hi Smikester, thanks buddy. Nice charts yourself, very clean. Are you actively trading this pair at the moment?
Ignored
I'm flat this pair at the moment. I placed a buy stop at .8310 this morning but very low margin. I'm glad it wasn't filled before the plunge.
I couldn't help noticing the twerps on the cable thread giving you a hard time. I only go there to read for a laugh and rarely post there now. Some good traders post there but I don't know why.
{quote} I'm flat this pair at the moment. I placed a buy stop at .8310 this morning but very low margin. I'm glad it wasn't filled before the plunge. I couldn't help noticing the twerps on the cable thread giving you a hard time. I only go there to read for a laugh and rarely post there now. Some good traders post there but I don't know why.
Ignored
I don't really post that much any more, or try not to. Like you it's good for a laugh and don't really take to much notice of any traders. I was on this forum in 2005 to 2008 under another alias but got away from it because of the same reasons. Also find it can disrupt your trading.
Theres a lot of inefficiencies in this pair to 8450 and then to 8550, so I'm sure it will run higher it's just picking the spot. I think it may test a little lower first and I've got 240 marked as a level but could go up from here.
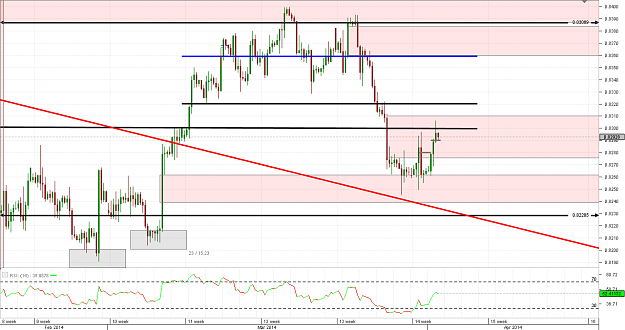
Still waiting for a deeper test into 240 - 200 before adding some new long positions. Took some small short positions for the day from 300 and managed to get some nice movement but have closed them out now and just waiting for lower level to enter long. {image}
Ignored
in my thinking, if the price break 240 (lower than 240), there will be a long distance for it to walk south
{quote} Hi Satfish, whats your thinking around why this is an important break level?
Ignored
the price hover between 240 and 280, in the bearish market 240 apparently is an important break level (bear).
however, 280 is not the break level for bull.
am i the same thinking with you?
{quote} the price hover between 240 and 280, in the bearish market 240 apparently is an important break level (bear). however, 280 is not the break level for bull. am i the same thinking with you?
Ignored
Hi Satfish, 240 was the breakaway level for the last bull run up to 400. It's a significant level in that it will have to be tested sometime. I don't think the break down of this level will indicate a bearish view. I see 160 area as a significant change and continuation of the bears for this pair however I think if price starts breaking down 220 and 200 this may be an indication that we are heading to 160.
|
Joined Jul 2010
|
Status: Prince of All Profits
|787 Posts
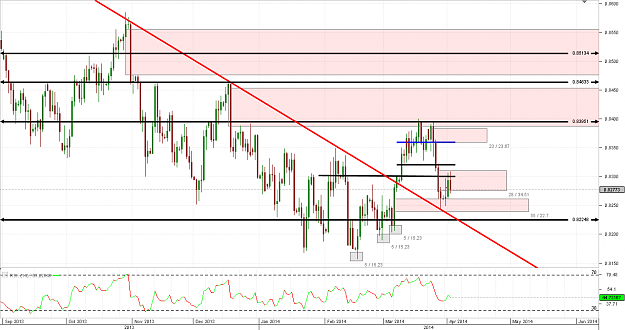
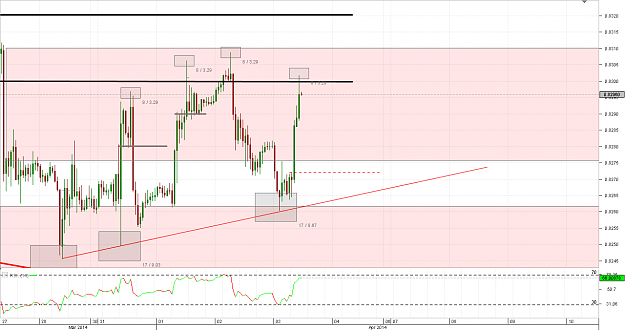
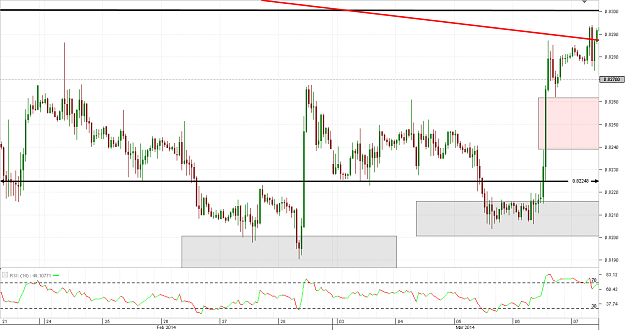
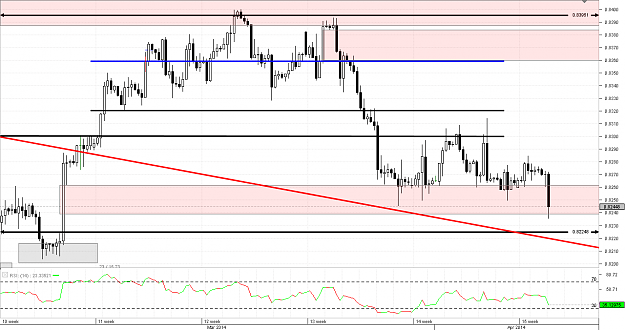
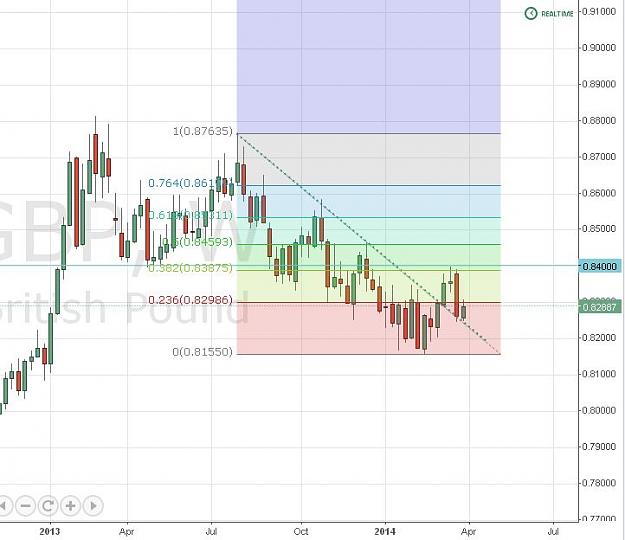
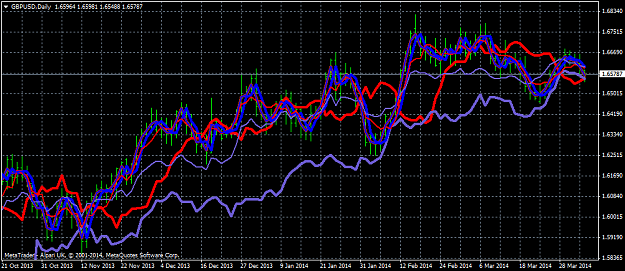
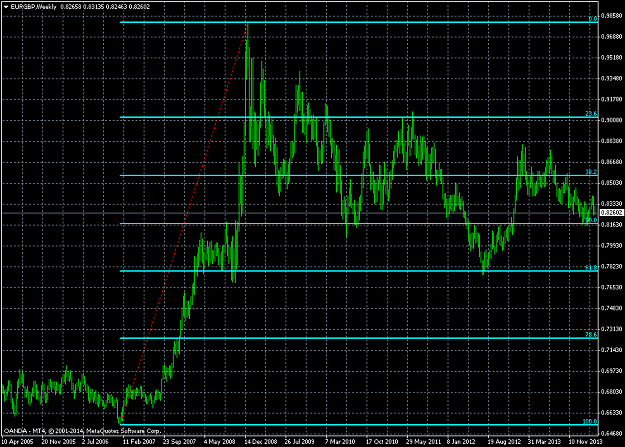
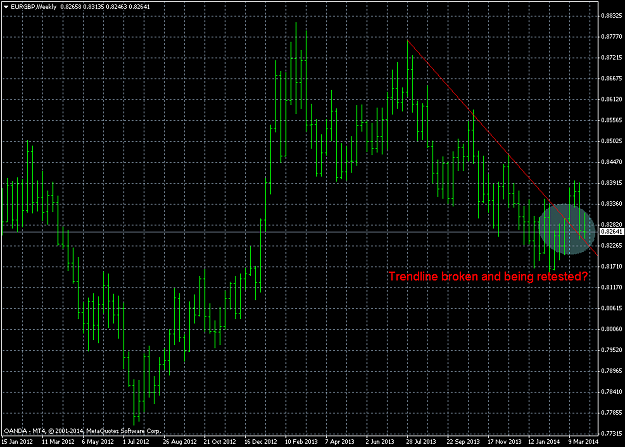
Alot of people on here saying down, down, down... And on the lower time frames, nothing really screams buy for sure. But let me give those thinking about buying a reason... 2 weekly charts, 1st one, showing a bounce off the 50 fib level, and the second one showing a trendline break and retest taking place. Will it hold... Who knows, time will tell. Have a great weekend.
Alot of people on here saying down, down, down... And on the lower time frames, nothing really screams buy for sure. But let me give those thinking about buying a reason... 2 weekly charts, 1st one, showing a bounce off the 50 fib level, and the second one showing a trendline break and retest taking place. Will it hold... Who knows, time will tell. Have a great weekend. {image} {image}
Ignored
I'm expecting a retest @ 1.658
A word to the wise ain't necessary - it's the stupid ones that need advice
Alot of people on here saying down, down, down... And on the lower time frames, nothing really screams buy for sure. But let me give those thinking about buying a reason... 2 weekly charts, 1st one, showing a bounce off the 50 fib level, and the second one showing a trendline break and retest taking place. Will it hold... Who knows, time will tell. Have a great weekend. {image} {image}
Ignored
Hi Nate,
I think most people recently are looking mid term bullish at this pair now.