DislikedHey Mark, I was curious how you deal with many lines being on the chart, do you have multiple instances up of the same chart or maybe color coded lines? For example, say I mark up H4 areas I am interested, then I go mark up some 1hr areas on the same chart, and I will then mark up LTF areas/DP's and then my chart is full of lines and I get confused why I put a line where I did. Then I ask myself is it a 5min line or a 4hr line, is this is a HTF DP or a LTF SR, different questions like that and I get confused. Maybe it's something you can get used...Ignored
Instance 1 - Daily and Weekly charts
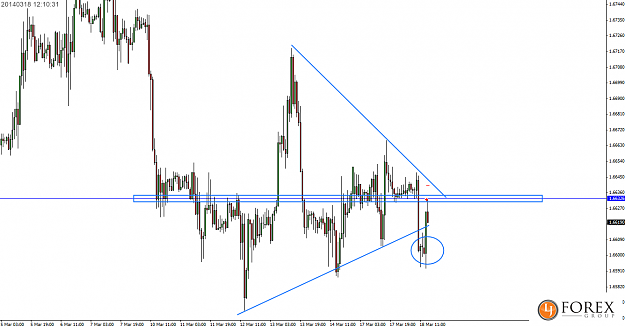
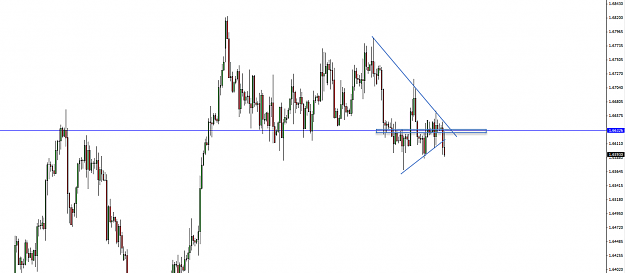
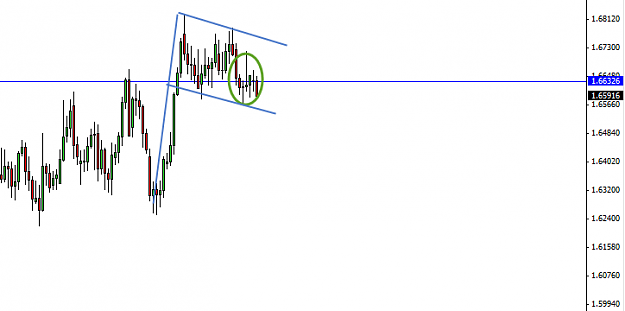
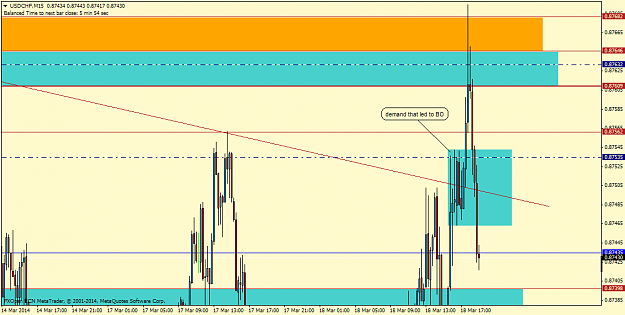
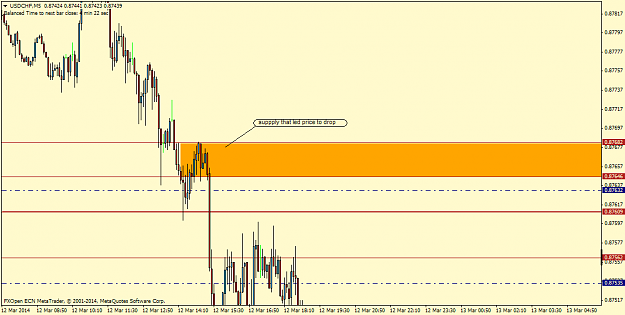
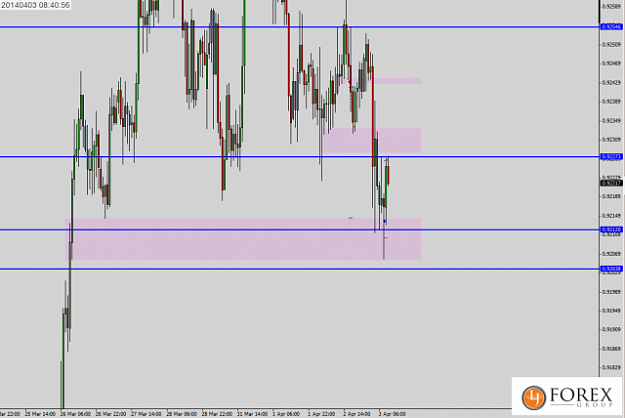
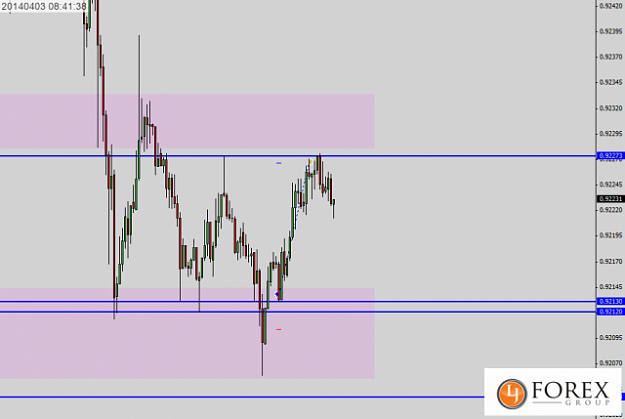
Instance 2 - H4 and H1 charts
I mark up major swings, SD zones and SR pivot zones on the above charts.
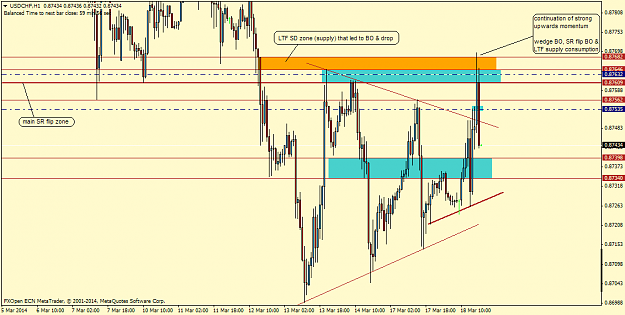
I then move the current relevant information from these charts together with the current SD structures / PA to blank H4 and H1 separate instances each morning.
So the actual charts I trade off only have current useful information present and thus are very 'clean'.