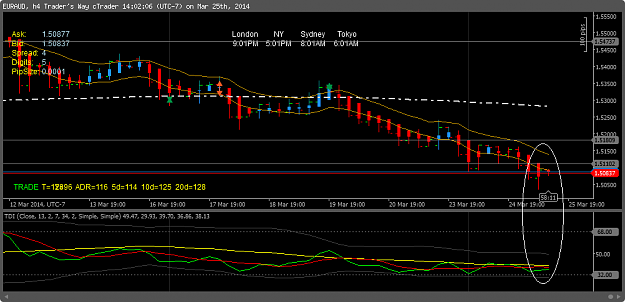
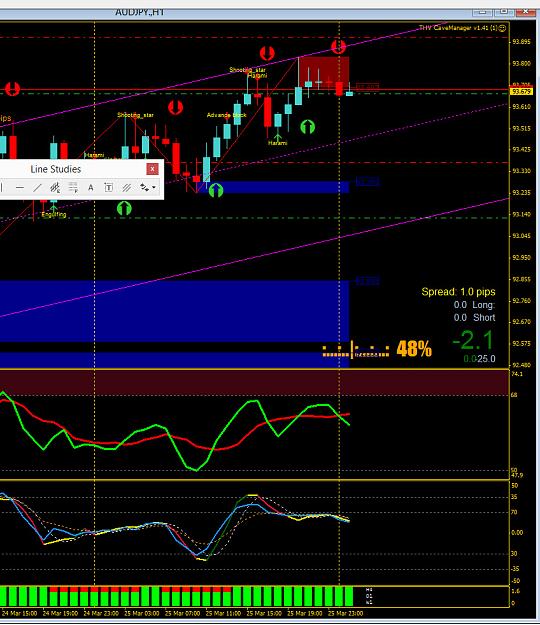
The CJ trade is on the right track. I'm hoping it can hit my 20 pip capital protection mark so it will go to breakeven and then It can just cruise up non-stop to my 100 pip TP {image}
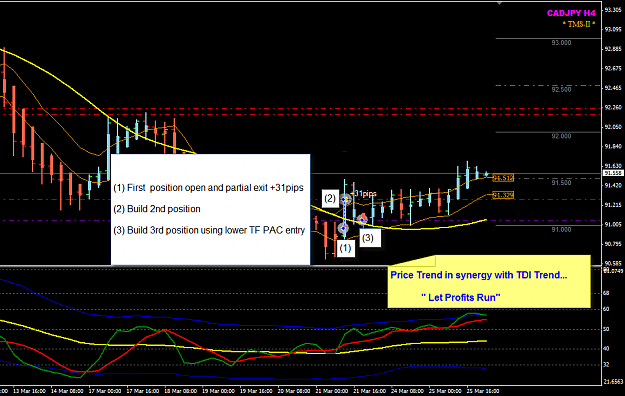
Update to post 33,841 at 1000 PDT: CADJPY H4 now a risk free position as I moved S/L into profit @ 91.03. Still holding to target of 91.98 while monitoring TDI approach of "68" area and price remaining in or above PAC. {image} Post 33,827 update follows suit: S/L moved into profit at 1.1215 and target dropped to 1.1120 from 1.1154. Will see where I'm at on the 1400 PDT review. {image}
Ignored
I got in a bar to late on CJ im hoping it continues up though.
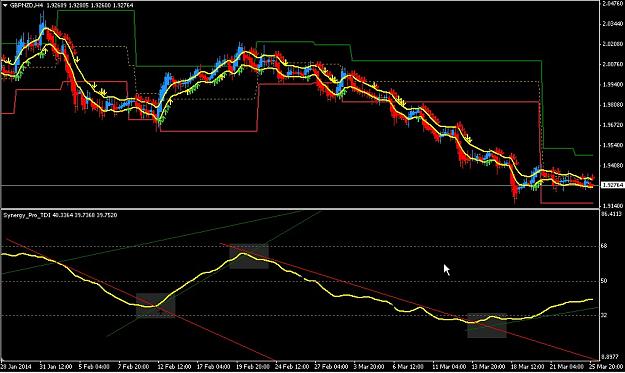
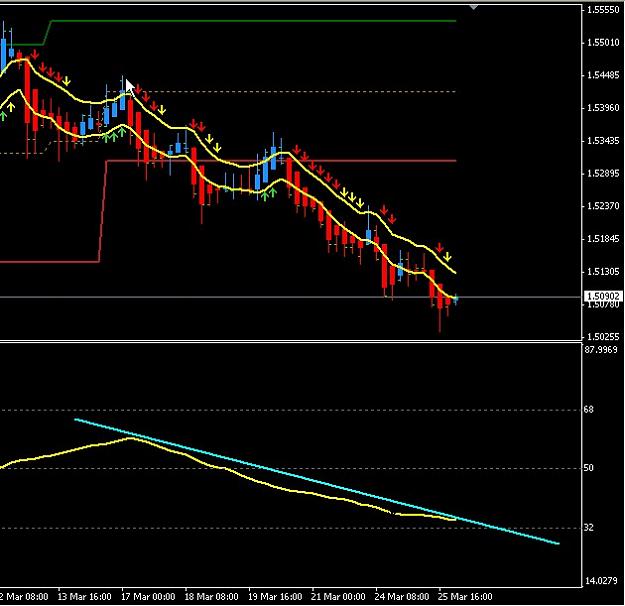
{quote} Hey zoopots, check out my chart, my signal seem to be off. is it because im using a different tdi than yours? different settings? mine are default. notice how your last trade your currently in crosses the oversold area and generates your buy, mine doesn't. it cross right above the 32 level. any ideas why? here is a pic depicting what im talking about. also my signal seems to have occured 4 hours earlier, any ideas? {image}
Ignored
4rextrader-
It may be the difference in brokers, I'm with FXDD whose Market Watch clock is +7 hours ahead of EDT. Go to your Market Watch menu and compare your broker's time just above the word "symbol" to Eastern time then you'll know if our two brokers are using the same time zone.
Looks to me like you did get a valid TDI entry it just happened one candle prior to mine.
My TDI is using default settings from the programmer...I don't know (or care) what they are...it's dependable.
If I'm reading your TDI indicator correctly, it did drop below "32" the candle previous to your green vertical line and 5 candles previous...so it did reach the area I pay attention to.
{quote} 4rextrader- It may be the difference in brokers, I'm with FXDD whose Market Watch clock is +7 hours ahead of EDT. Go to your Market Watch menu and compare your broker's time just above the word "symbol" to Eastern time then you'll know if our two brokers are using the same time zone. Looks to me like you did get a valid TDI entry it just happened one candle prior to mine. My TDI is using default settings from the programmer...I don't know (or care) what they are...it's dependable. If I'm reading your TDI indicator correctly, it did drop...
Ignored
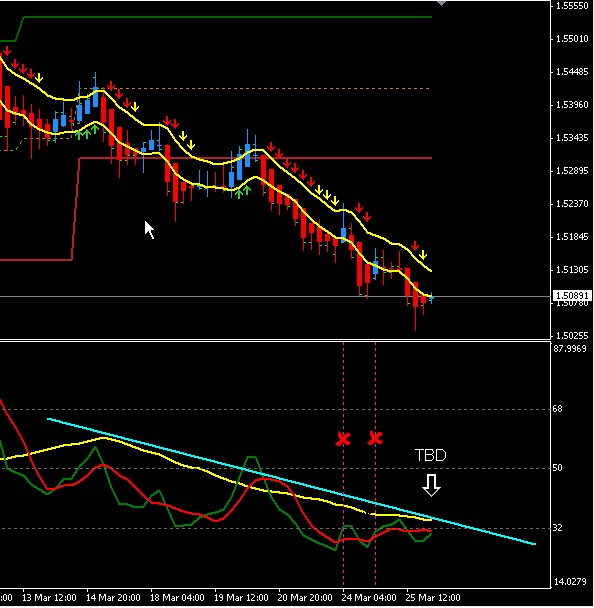
ya i see what ur saying. so the cross doesn't necessarly have to occur under or above the overbought oversold areas, the tdi just needs to reach to begin looking for tdi signals or doth the red and green line of the tdi have cross below and above the 32 and 68 level? sorry for all the questions. i just really wana understand this. Also take a look at my chart, how would decide not to get into these trades marked by the green line?
[quote=Zoopots;7361481]Trading the H4 chart requires some patience...
Thanks for that great post Zoopots. Good to hear that even an old fighter pilot can understand this. There might still be hope for me then!
Still struggling to become profitable in this business, but a big thanks to everyone who contributes here. Learning more every day!
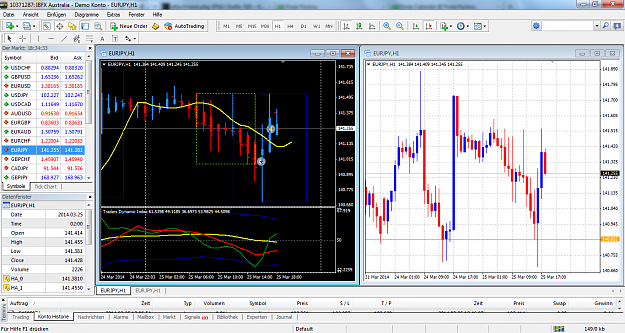
EJ hit weekly support level. There´s i divergence on H1. Perhaps interesting to go long at the break of last candles high and TDI cross. Regards, Fx94 {image}
Ignored
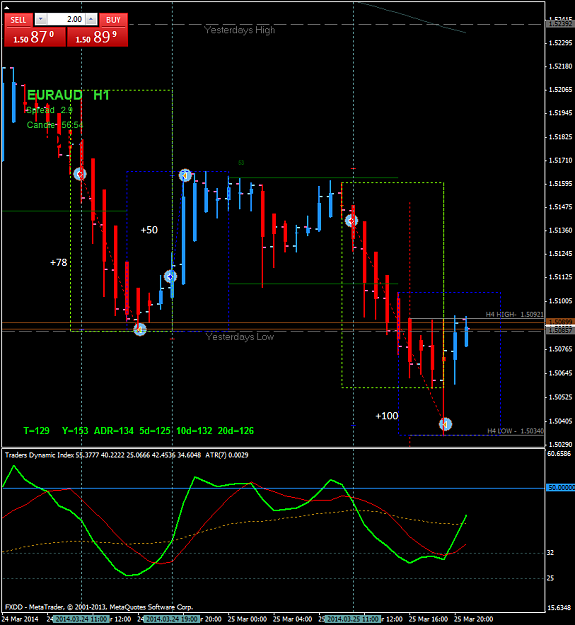
This trade went in my direction. Take a look at my charts. Please feel free to comment. Made +25 pips. My TP of 50 pips would have been hit, if i have stayed into the trade. Perhaps you can help me, how i can get the information when to exit on H1 trading ?
Reasons for entry:
- support at 140.852 weekly support
- long wicked candle (pullback candle)
- TDI cross coming from 32 level
-divergence as I posted in the Post 3 hours ago. It´s also linked in this Post
{quote} This trade went in my direction. Take a look at my charts. Please feel free to comment. Made +25 pips. My TP of 50 pips would have been hit, if i have stayed into the trade. Perhaps you can help me, how i can get the information when to exit on H1 trading ? Reasons for entry: - support at 140.852 weekly support - long wicked candle (pullback candle) - TDI cross coming from 32 level -divergence as I posted in the Post 3 hours ago. It´s also linked in this Post TP was set at the high of london session. Best regards, Fx94 {image}
Ignored
You have lots of reasons to enter....why did you exit, what were the things you saw that made you exit?
{quote}You have lots of reasons to enter....why did you exit, what were the things you saw that made you exit?
Ignored
I think I am to little confident in trading. That´s because why I am asking for help here to get a TP. I don´t know how much I can want for a trade to give me.
I have no idea about putting take profit in H1 Trading. Often you can put the SL "x" pips below/above last candles high/low when a trend occurs. But in this case I have no idea.
{quote} 4rextrader- It may be the difference in brokers, I'm with FXDD whose Market Watch clock is +7 hours ahead of EDT. Go to your Market Watch menu and compare your broker's time just above the word "symbol" to Eastern time then you'll know if our two brokers are using the same time zone. Looks to me like you did get a valid TDI entry it just happened one candle prior to mine. My TDI is using default settings from the programmer...I don't know (or care) what they are...it's dependable. If I'm reading your TDI indicator correctly, it did drop...
Ignored
Zoo,
Are you always looking for it to be below 32 / above 68? Or if it is near those levels (as below) is that something you would trade? Assuming of course it DID cross.
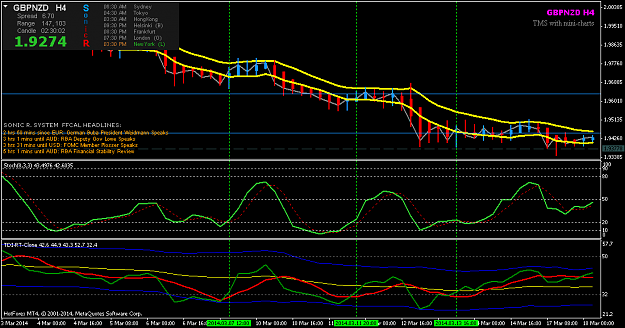
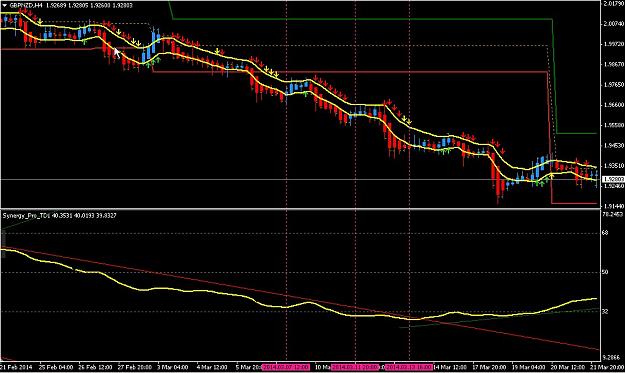
{quote} ya i see what ur saying. so the cross doesn't necessarly have to occur under or above the overbought oversold areas, the tdi just needs to reach to begin looking for tdi signals or doth the red and green line of the tdi have cross below and above the 32 and 68 level? sorry for all the questions. i just really wana understand this. Also take a look at my chart, how would decide not to get into these trades marked by the green line? {image}
Ignored
First, this isn't a pair I monitor so I'm not real familiar with its personality.
I have learned to place a lot of emphasis on the Market Base Line, particularly the slope of the MBL. It gives a somewhat truer representation of the price sentiment (often called trend). We need to realize that the MBL almost always reacts like a drunk driving down the road: He drifts to the left ("68") then gets startled when he hits the gravel and corrects to the center of the highway ("50") but then drifts to the right, hits the gravel again at ("32") gets startled and corrects back to the center line. That's how it was taught to me over 6 years ago. Look at this picture of just the MBL on your chart in question; GBPNZD H4. I've pulled in a lot of candles and deleted everything but the MBL on the TDI. Do you see the rhythm of the drunk driver? He veers left to overbought, then veers right to oversold. I have placed trend lines on the MBL to highlight the overall sentiment of the pair.
Attached Image (click to enlarge)
Now to your entries you asked about, what I see right off is that all of them, 3/7/1200, 3/11/200 and 3/13/1600 are all suggesting longs contrary to the MBL----the entries are fighting the down trend (the slope of the PACs tell you this as well but they give whipsaws as they are 5 EMAs.)
Attached Image (click to enlarge)
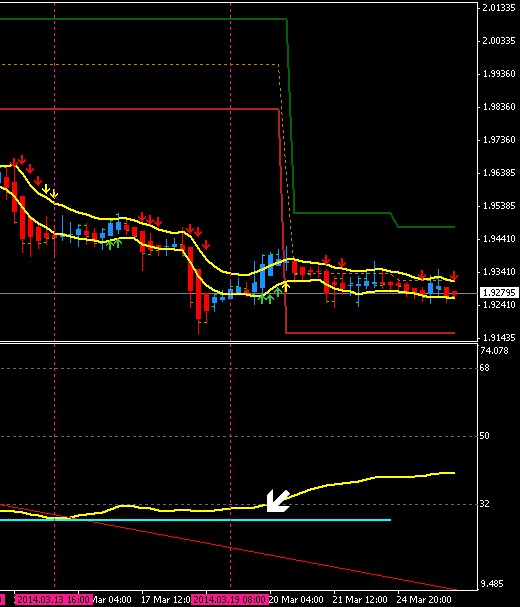
The first TDI signal to consider, in my judgment, is the 3/19/0800 long. Notice the MBL is finally correcting back to the "50" area (white arrow). I would have passed on this entry though as the trigger was 1.9299 and S/L the swing low of 3/18/1600 1.9160 140 pips away...too rich for my blood. It did push up 120 pips but that's not good risk-to-reward. Also, I would think the events in Crimea are weakening the Cable some...pretty strong sell.
{quote} First, this isn't a pair I monitor so I'm not real familiar with its personality. I have learned to place a lot of emphasis on the Market Base Line, particularly the slope of the MBL. It gives a somewhat truer representation of the price sentiment (often called trend). We need to realize that the MBL almost always reacts like a drunk driving down the road: He drifts to the left ("68") then gets startled when he hits the gravel and corrects to the center of the highway ("50") but then drifts to the right, hits the gravel again at ("32") gets...
Ignored
Interesting. I was watching one of Dean Malones strategies and in one he suggests deleting the signal line and trading the cross of green over the MBL I think (in choppy markets I think)
{quote} Zoo, Are you always looking for it to be below 32 / above 68? Or if it is near those levels (as below) is that something you would trade? Assuming of course it DID cross. {image}
Ignored
Always greater than 68 or less than 32. If it doesn't hit these areas...I move on to something else. I, personally, would not have taken the entry in your picture...the TDI crosses are fighting the MBL, it's a no go. True, you can always find an example like yours that eventually "worked", but you can find tons of them that don't. I just find it easier to K.I.S.S.
{quote} First, this isn't a pair I monitor so I'm not real familiar with its personality. I have learned to place a lot of emphasis on the Market Base Line, particularly the slope of the MBL. It gives a somewhat truer representation of the price sentiment (often called trend). We need to realize that the MBL almost always reacts like a drunk driving down the road: He drifts to the left ("68") then gets startled when he hits the gravel and corrects to the center of the highway ("50") but then drifts to the right, hits the gravel again at ("32") gets...
Ignored
Thank you for the great explanation of what you are looking at.
{quote} Always greater than 68 or less than 32. If it doesn't hit these areas...I move on to something else. I, personally, would not have taken the entry in your picture...the TDI never penetrated below 32, so for me, it's a no go. True, you can always find an example like yours that eventually "worked", but you can find tons of them that don't. I just find it easier to K.I.S.S. Zoopots
Ignored
So you only take but a few trades per month, and you look at every 4H candle for set ups, correct?
{quote} First, this isn't a pair I monitor so I'm not real familiar with its personality. I have learned to place a lot of emphasis on the Market Base Line, particularly the slope of the MBL. It gives a somewhat truer representation of the price sentiment (often called trend). We need to realize that the MBL almost always reacts like a drunk driving down the road: He drifts to the left ("68") then gets startled when he hits the gravel and corrects to the center of the highway ("50") but then drifts to the right, hits the gravel again at ("32") gets...
Ignored
thanks zoopots, i appreciate all your help. now from some practicing!
{quote} Thank you for the great explanation of what you are looking at. {quote} So you only take but a few trades per month, and you look at every 4H candle for set ups, correct?
Ignored
Well, for example, my favorite pair the AUDJPY H4 has had 7 entries in 2014 that I took, one loser. In 2014 it has had 7 individual runs over 200 pips each...that's what I hope to capture. If I can get 150 pips out of those runs and a S/L of say 70 pips, That's 150 X 6 = 900 - 70 = 830 profit (less spreads). I have found the runs are less in the summer, but lots of pairs slow down then. I don't have 20 pairs I watch...just my favorites. It's a marathon...not a sprint (especially at my age).
Some people don't like my strategy because they want more action...more involvement....more Maalox moments. Me, I just want to be the turtle that eventually catches the rabbit. To each his own, I say.
{quote} First, this isn't a pair I monitor so I'm not real familiar with its personality. I have learned to place a lot of emphasis on the Market Base Line, particularly the slope of the MBL. It gives a somewhat truer representation of the price sentiment (often called trend). We need to realize that the MBL almost always reacts like a drunk driving down the road: He drifts to the left ("68") then gets startled when he hits the gravel and corrects to the center of the highway ("50") but then drifts to the right, hits the gravel again at ("32") gets...
Ignored
Zoopots, your analogies are great! Thank you for your knowledge.
I'm hoping it can hit my 20 pip capital protection mark so it will go to breakeven and then It can just cruise up non-stop to my 100 pip TP {image}
Ignored