Sometimes when you search something you find something else...
I was (and still am) looking for a good estimator of the trend. Without being a DSP guru, whoever played around with some moving averages quickly realized that if you want the result smooth you get lag. You can remove the lag but you get overshooting; which is as bad. To reduce the overshooting you give back the smoothness. A vicious cycle with no escape. I'm no exception and my trend estimator suffers from annoying residual oscillations. Those oscillations are mainly due to the wide oscillations the price can make during volatile trends and during the wide ranges. In order to reduce the oscillations I wanted to measure the cyclic components of the time series. If I can measure it I can remove it. If I can remove it I can get rid of the oscillations.
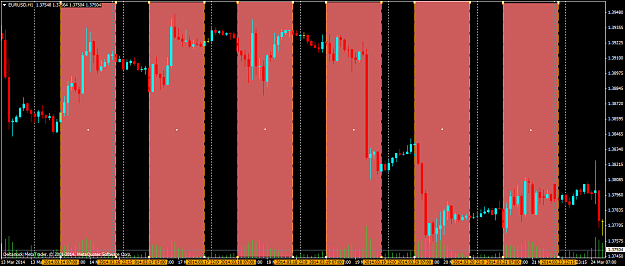
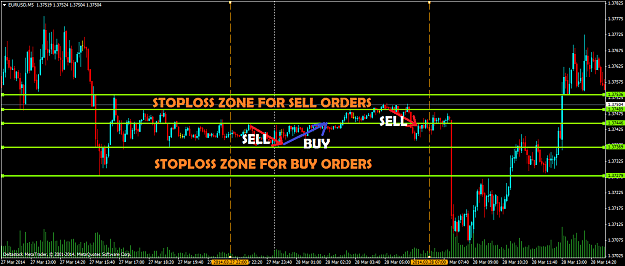
Let's see in picture what I mean. Here is the kind of oscillations I'd like to remove:
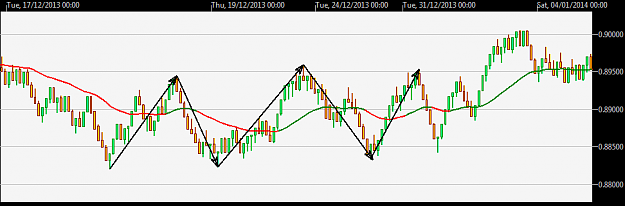
When the oscillations of the price are small enough the estimator absorbs them. But when the amplitude of the oscillations gets bigger they become an issue. To form such a movement the market needs some time and therefore these oscillations can't have a too short period. I target the oscillations of approx. 10 to 30 bars per cycle.
If you're also looking for a way to estimate these cycles, you certainly have already heard about the Goertzel algorithm. It is very precise but it requires three full cycles to detect the frequency it is tunned on. You can detect only one predefined frequency. You surely also know John Ehlers' work, namely the dual differentiator and the homodyne filter. The dual differentiator gives a result quickly but it overshoots in the frequency domain: the detection is fast but... wrong! The homodyne filter lags 21 bars and when a cycle is detected it's usually already gone. I tried Hilbert wavelet pair transform (http://www.forexfactory.com/showthre...09#post7008809) but due to the end of sample effect of the wavelet transform I could only have lag and not-so-acurate measurements.
Here is a very simple solution
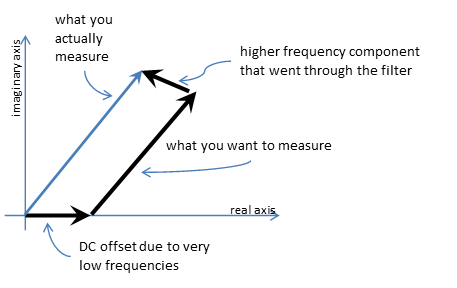
I use a bandpass filter for the range of frequencies I'm interested in. This way I remove both the high frequency (noise) and the trend, so that I won't have to detrend the samples to measure the cycles. I take the assumption that there is only one single big cycle at a time in this range. This isn't always true.
The output of the filter is roughly looking like a sine wave. I just need to take its Hilbert transform to measure the frequency, the amplitude and the phase (timing within the cycle). The Hilbert transform of sin(x) is -cos(x). It happens that the derivative of sin(x) is cos(x) which is the HT up to the sign. The general form of the sine wave is A.sin(ωt+φ), where A is the amplitude, ω is the frequency and φ is the phase. The problem is that the derivative of A.sin(ωt+φ) is Aω.cos(ωt+φ). But we need A.cos(ωt+φ). The multiplicative factor ω is not wanted. We don't know the frequency since it is what we're trying the estimate so we can't remove it. The integral of sin(x) is -cos(x) which is the HT. Computing the integral of A.sin(ωt+φ) we get -(A/ω).cos(ωt+φ). Now we have a factor 1/ω to get rid of.
I simply mutiply the derivative and the integral. I get -A²cos²(ωt+φ). Taking the square root of the absolute value (to avoid sign problem) I obtain |A.cos(ωt+φ)| which is the HT up to the sign. But the sign is the same as the one of the derivative and nothing is lost.
S = A.sin(ωt+φ)
D = dS / dt = Aω.cos(ωt+φ)
I = ∫S dt = -(A/ω).cos(ωt+φ)
D.I = -A²cos²(ωt+φ)
HT = sgn(D).√|D.I|
From the in-phase and quadrature I get the amplitude A=√(S²+HT²) and the phase using atan(HT/S) up to quadrant identification. Taking two sequential measurements allows to find the frequency which is the derivative of the phase.
Two little problems
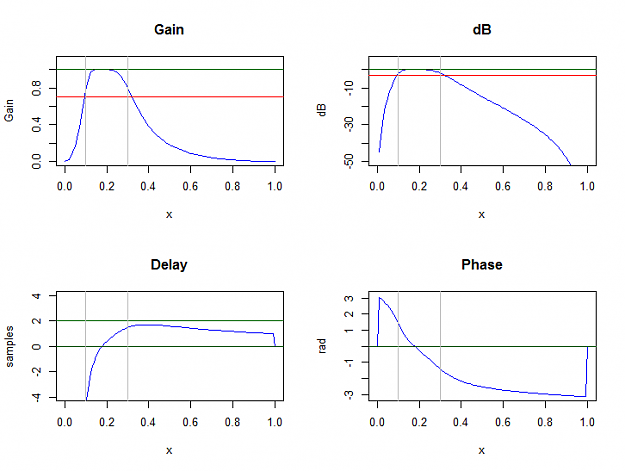
- The measured amplitude is smaller than the real one because the signal is taken after the bandpass filter. But knowning the frequency response of the filter we can correct the amplitude now we know the frequency. A_price = A_measured/|H(ω)|, where H(ω) is the transfer function of the filter.
- The signal is not always made of a single cycle and the trick no longer works. The solution is to check whether the estimation fits the few past samples or not.
About the lag
To get the results we need the integral and the derivative of the signal output by the banbdpass filter and the derivative of the resulting phase to get the frequency. The integration has no lag. The derivation has half a sample lag. We need another sample to measure the frequency. So we have one bar and a half lag on top of the filter. I use a short IIR filter to have it as low as possible ~1 bar. Obviously I get phase distortion as the price to pay but I have near real time estimation.
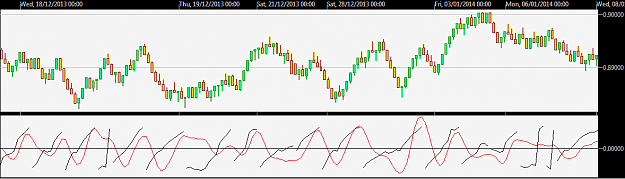
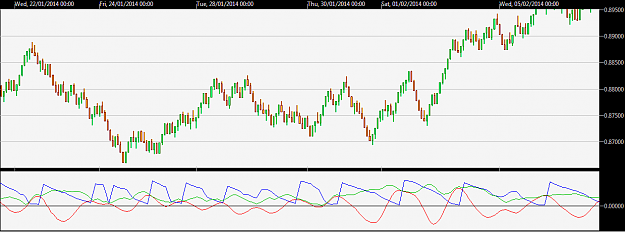
And the result
In red the output of the filter, in green the amplitude (not frequency adjusted) and in blue the instantaneous phase.
I hope this little finding may help someone.
I was (and still am) looking for a good estimator of the trend. Without being a DSP guru, whoever played around with some moving averages quickly realized that if you want the result smooth you get lag. You can remove the lag but you get overshooting; which is as bad. To reduce the overshooting you give back the smoothness. A vicious cycle with no escape. I'm no exception and my trend estimator suffers from annoying residual oscillations. Those oscillations are mainly due to the wide oscillations the price can make during volatile trends and during the wide ranges. In order to reduce the oscillations I wanted to measure the cyclic components of the time series. If I can measure it I can remove it. If I can remove it I can get rid of the oscillations.
Let's see in picture what I mean. Here is the kind of oscillations I'd like to remove:
Attached Image (click to enlarge)
When the oscillations of the price are small enough the estimator absorbs them. But when the amplitude of the oscillations gets bigger they become an issue. To form such a movement the market needs some time and therefore these oscillations can't have a too short period. I target the oscillations of approx. 10 to 30 bars per cycle.
If you're also looking for a way to estimate these cycles, you certainly have already heard about the Goertzel algorithm. It is very precise but it requires three full cycles to detect the frequency it is tunned on. You can detect only one predefined frequency. You surely also know John Ehlers' work, namely the dual differentiator and the homodyne filter. The dual differentiator gives a result quickly but it overshoots in the frequency domain: the detection is fast but... wrong! The homodyne filter lags 21 bars and when a cycle is detected it's usually already gone. I tried Hilbert wavelet pair transform (http://www.forexfactory.com/showthre...09#post7008809) but due to the end of sample effect of the wavelet transform I could only have lag and not-so-acurate measurements.
Here is a very simple solution
I use a bandpass filter for the range of frequencies I'm interested in. This way I remove both the high frequency (noise) and the trend, so that I won't have to detrend the samples to measure the cycles. I take the assumption that there is only one single big cycle at a time in this range. This isn't always true.
The output of the filter is roughly looking like a sine wave. I just need to take its Hilbert transform to measure the frequency, the amplitude and the phase (timing within the cycle). The Hilbert transform of sin(x) is -cos(x). It happens that the derivative of sin(x) is cos(x) which is the HT up to the sign. The general form of the sine wave is A.sin(ωt+φ), where A is the amplitude, ω is the frequency and φ is the phase. The problem is that the derivative of A.sin(ωt+φ) is Aω.cos(ωt+φ). But we need A.cos(ωt+φ). The multiplicative factor ω is not wanted. We don't know the frequency since it is what we're trying the estimate so we can't remove it. The integral of sin(x) is -cos(x) which is the HT. Computing the integral of A.sin(ωt+φ) we get -(A/ω).cos(ωt+φ). Now we have a factor 1/ω to get rid of.
I simply mutiply the derivative and the integral. I get -A²cos²(ωt+φ). Taking the square root of the absolute value (to avoid sign problem) I obtain |A.cos(ωt+φ)| which is the HT up to the sign. But the sign is the same as the one of the derivative and nothing is lost.
S = A.sin(ωt+φ)
D = dS / dt = Aω.cos(ωt+φ)
I = ∫S dt = -(A/ω).cos(ωt+φ)
D.I = -A²cos²(ωt+φ)
HT = sgn(D).√|D.I|
From the in-phase and quadrature I get the amplitude A=√(S²+HT²) and the phase using atan(HT/S) up to quadrant identification. Taking two sequential measurements allows to find the frequency which is the derivative of the phase.
Two little problems
- The measured amplitude is smaller than the real one because the signal is taken after the bandpass filter. But knowning the frequency response of the filter we can correct the amplitude now we know the frequency. A_price = A_measured/|H(ω)|, where H(ω) is the transfer function of the filter.
- The signal is not always made of a single cycle and the trick no longer works. The solution is to check whether the estimation fits the few past samples or not.
About the lag
To get the results we need the integral and the derivative of the signal output by the banbdpass filter and the derivative of the resulting phase to get the frequency. The integration has no lag. The derivation has half a sample lag. We need another sample to measure the frequency. So we have one bar and a half lag on top of the filter. I use a short IIR filter to have it as low as possible ~1 bar. Obviously I get phase distortion as the price to pay but I have near real time estimation.
And the result
In red the output of the filter, in green the amplitude (not frequency adjusted) and in blue the instantaneous phase.
Attached Image (click to enlarge)
I hope this little finding may help someone.
No greed. No fear. Just maths.