Disliked{quote} I would be careful with trading rooms or groups while your trading. It can lead to too many distractions and you could be taking advice from someone who has no idea what their doing. My biggest thing I learned in trading over 7+ years of trading. The number of people who think they know how to trade 95% compared to the 5% who actually know how to trade.Ignored
95% of the people who are trading currency pairs do this to make profit. 5% do trading but NOT to make profit (examples are: if you travel to Turkey and change euros to Turkish lira; if Philips US made a new technological innovation then lots of dollars will be exchanged).
These 95% people who DO aim for making profit use (appearantly) different methods/strategies. The clue is, the most used methods/strategies work the best. That's how the market works. This means:
- of these 95% the gross will draw trendlines
- use Moving Average 100 and 200
These two work the best, because they are most used. Less used tools but still just enough so that they work are:
- fibonacci
- macd (since this consists of MAs it makes sense that it works well)
As you probably understand, most forex traders don't even know how every feature of macd works which makes this tool less trustworthy than for example drawing trendlines.
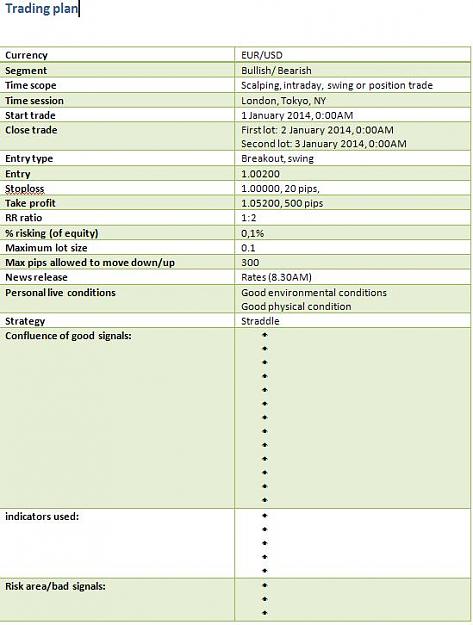
The rule in forex trading is: the less indicators, the better. Usually 3 indicators is best.
Other rule is: the more good signals, the better. Note: signals NOT from indicators. I did my best for you to accumulate over 60 good signals to cross (say: check) before entering a trade. (I wrote everything myself)
Good signals in a continuation:
- lower low (when main trend goes down)/ higher high (when main trend goes up)
- Triangle formation
- Good signal: first bond markets move, then forex moves. (so if gold/oil goes up, dollar goes down soon after)
- CAD/JPY and the price of oil: Canadian dollar imports 99% oil. So if the value of oil rises, then CAD rises and USD drops. When the value of gold rises, USD drops.
- Longer-term trendlines are more trustworthy than short-term trendlines
- Other pairs (with this currency) going the same direction
- High volume
- Next candle higher (in uptrend)
- Next candle lower (in downtrend)
- The larger the candle
- Candlesticks in continuation: Counter attack pattern
- Trendlines
- Counter-trendlines
- usually there is a continuation after news peek (when it went the wrong direction)
Good signal in a reversal:
- Trible top
- Double top
- trends usually go in the opposite direction of the spike
- The newer the (market price) level
- The longer the (white) candle than the previous (black) candle
- The longer round number hasn’t been seen
- Broken trendline
- Extremely overbought/oversold
- divergence
- Low volume- The longer the shadow to the wrong direction (compared to previous)
- The longer the consolidation
- Candlesticks:
Tweezers (only in weekly/monthly chart)
Doji
Spinning top
engulving pattern
Hammer
Hanging man
Morning star
Evening star
Belt-hold
Piercing pattern
Harami pattern
Harami cross
Railroad track
- Formations:
Head and shoulders
Break-formation
Wedge (2 lines getting smaller)(first oscillator then trend indicator)
123 (W/M)
3 pyramids
Mushroom/saucer
Good signals in a confluence:
- Breakout> retest> continuation
- Breakout (range: triangle/pennant/flag (not trustworthy))
- Breakout (divergence in indicator window)
- Old SR becomes new SR
- After 7-12 higher highs (it’s overbought), then usually the market goes down (on daily/weekly chart)
- if the upper shadow gets above the top red line (resistance 1)(aka retesting/crack and snap). No ‘real body’ (of a candle) closed above it.
- Long at overbought
- Short at oversold
- Higher timeframes (3 timeframes in 1 direction)
- High volume
- Next candle is higher/lower
- No news: 10PM-1AM (eastern time)
- High volatility timezone: 9-10, 14-18 (Dutch time)
- Within ATR (daily range)
- Pending order on resistance/support level (previous swing)
- Buy/sell at lowest/highest point
- Enter a bit before
- Round number
- Half number
- Breakout + Fibonacci
- Clean breakout
- Clean formation
- Clean candle pattern
- High volatility
- (suddenly) high volume is breakout
- At psychological price level
- The more times SR is bounced at
- The more current SR bounce is
- Fibonacci:
- the longer the timeframe (height of pips)
- double fib (eg. daily 50% and monthly 61.8%)
- Good RR
- Use trailing stop (instead of TP)
- Close trade before Wednesday 10PM (Dutch time)(avoid triple rollover)
- When entering a trade, don’t put it where you want to enter, but instead put it at stoploss level (as pending order)
- Bearish when market price is at the top
- Bullish when market price is at the bottom
Does anybody else know other good signals?
Join our skype group.