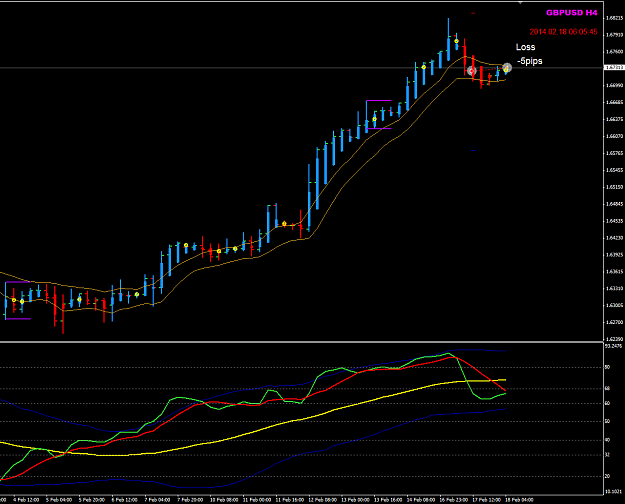
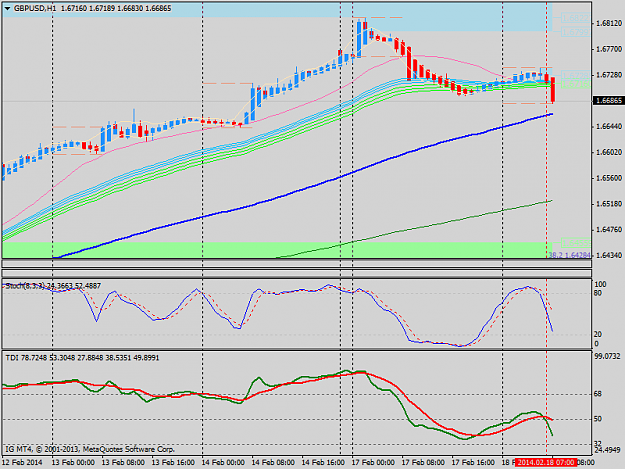
Disliked{quote} To be honest, during Big Picture Planning I saw GU was really overbought and hitting a level last seen in 2011, I was looking for any bearish sign, despite being aware how risky it is to take IB as reversal signal. In this particular case the difference between IB close and mother candle break was around 20 or so pips so who cares. I had "high hopes" for a swing trade but only later I saw the calendar... So I guess we're waiting for the news to kick it up a notch. I'll scale out and make a tighter SL on remaining position and probably put...Ignored
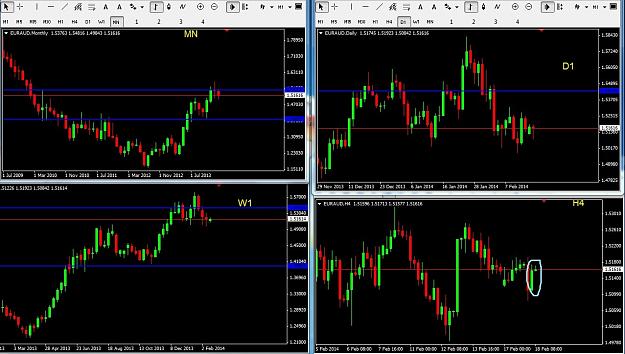
here is what I suggest, start with Big Picture Planning approach.
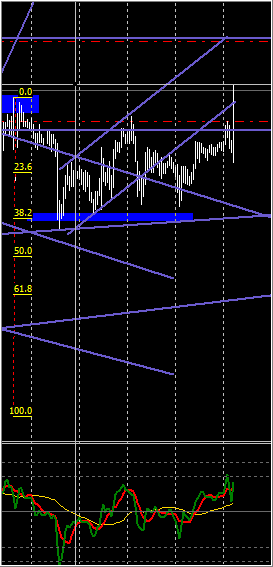
Look at MN charts, see where the last time we have a close price where buyers and seller agreed. Draw a line across your chart. That my MN swing level.
Then go down to Weekly chart, see where PA is in relation to the nearest MN Close price swing level. Do you see a particular candlestick pattern or bar pattern?
Go to D chart, what you see as the market type?
trending or sideways?
if sideways, is that narrow range sideways or wide range sideways?
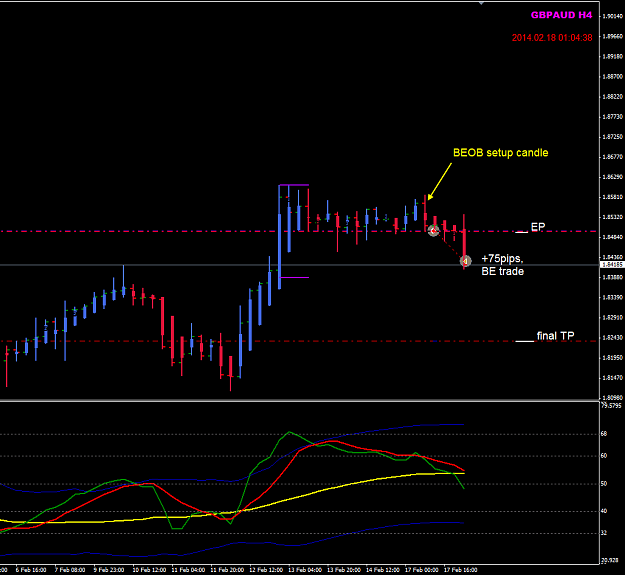
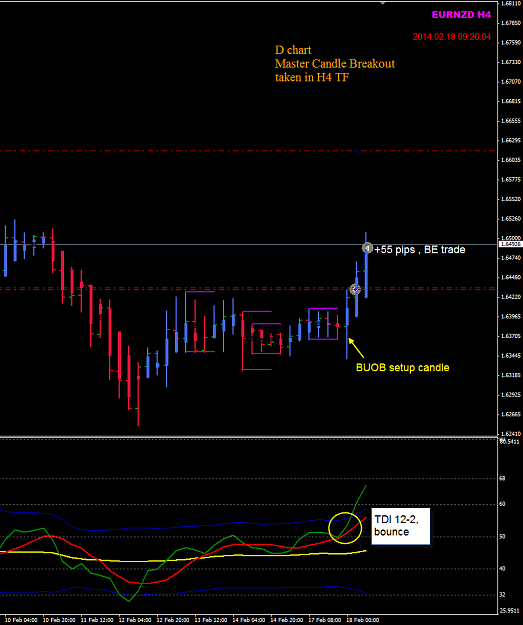
is there any candlestick pattern we can use at the setup? Master Candle, Inside Bar,
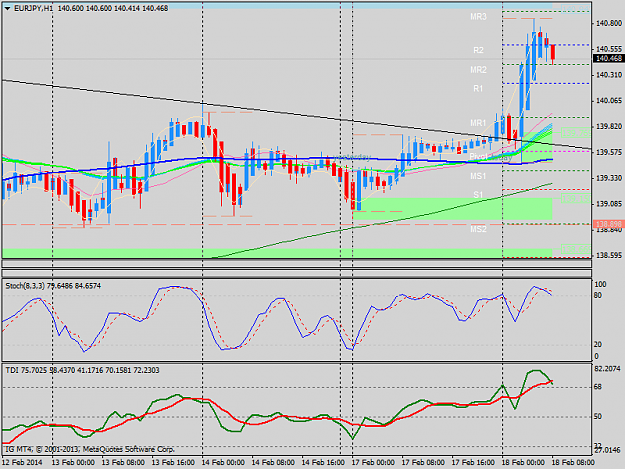
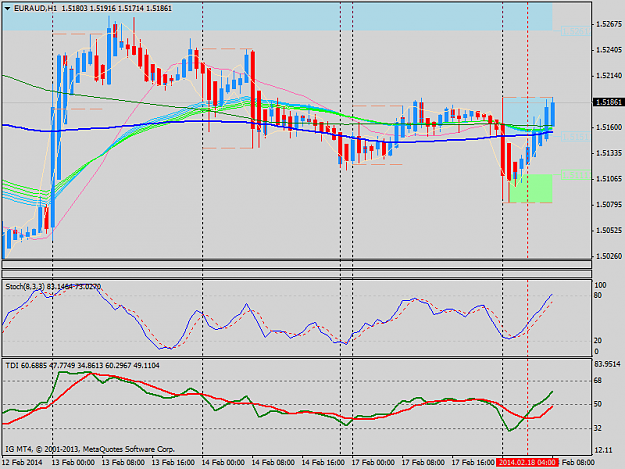
No on our trading chart TF H4,
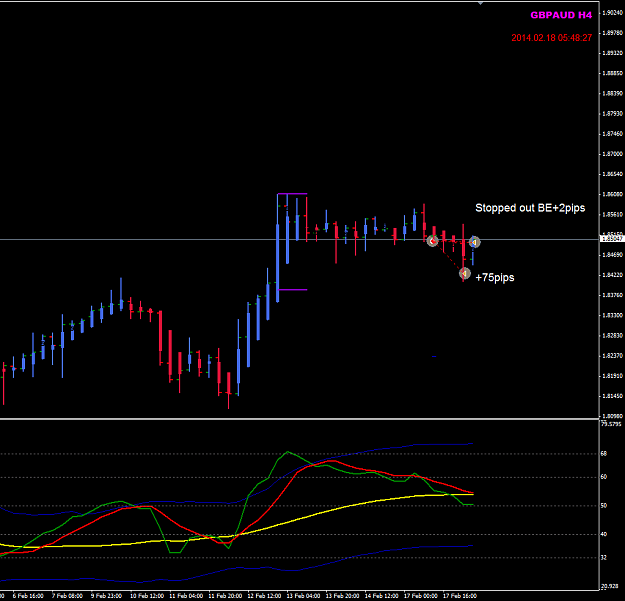
do we see 3-bars reversal setups? IB breakot setups?
do we see the APB/HA PA ?
do we have TDI condition we look for ? TDI cross, 12-2, 4-6 ... to confirm the PA?
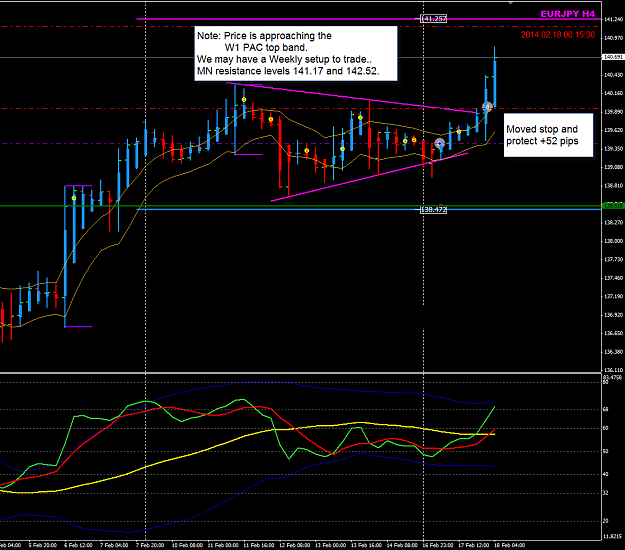
where are the recent nearby support and resistance on H4? Previous D OHLC, Prev D Fib? RN , and where are those MN swing levels, where are those Weekly swing levels?
I ask these all the time when I look at my charts.
Try it.
That will help make trading decisions much quicker and easier.
regards,
EMMANUEL
Honesty is a very expensive gift. You wont find it in cheap people.WBuffett