What an interesting Thread, nothing like relieving oneself of market stress... But just like a wall, if you look hard enough you will see window or a crack that may turn to a window. For those who are interested in what the yearly chart of the Eur/Usd looks like...I attached it.
The market's are not mechanical. There is no 'method', it is not mechanical, there is no magical indicator or bar. But the lines are in very specific places, and I can't be @rsed to draw all of them. You have to learn to think for yourself.
Hi nunrqqy, would you please tell me about above chart more. what is the white line is it candles. I want to learn your trading style.
Ignored
The chart to which you refer has 3 white lines. At some point price is no longer cheap enough to buy and at some point it is no longer too expensive to sell.
{quote} The chart to which you refer has 3 white lines. At some point price is no longer cheap enough to buy and at some point it is no longer to expensive to sell.
Ignored
yeah I noticed this a while ago, price goes up, and price goes down....
buy when its going up and sell when it's going down,
The market is very quiet atm. Now is the time to pounce on it like the cat. Tingalingaling. Put everything you've got on long. 7 pips stop.
Ignored
I've very glad you chose 7 pips. 7 is a very auspicious number.
There are the obvious connections:
The seven deadly sins, which all good traders should aspire to.
Then there is the Magnificent Seven, a thinly-guised plot which many thought was about a small mexican village being pillaged every year by an evil bandit. But anybody with an ounce of imagination could see the small Mexican village was in fact "the Market", Calvera was the epitomy of brokers, and then of course there was Yul Brynner who is not dissimilar to Bombay Trader's cat.
Snow White - she made sure she had 7 dwarves (not 6, not 8).
Three wise men... what did they ride on? Camels. One each. That makes a total of 6. Plus I think there was a cat in there somewhere too. That'll make 7.
The connections to 7 are uncanny. As a result, I always split my trades into 7 smaller trades and then place them in quick succession. But I'm only allowed to press the button with my right thumb. Otherwise the trade doesn't work.
Your numerology skills do you proud and I see you possess great wisdom - even more so as the market to which you refer was stolen from the Japanese which brings us back to Stale Wind...
Everything is circular, including trend lines.
{quote} yeah I noticed this a while ago, price goes up, and price goes down.... buy when its going up and sell when it's going down, you got a 50/50 if you get that bit wrong anyway.
Ignored
Very true, well spotted, but also of note is it has to go down before it can go up and go up before it can go down. Then you buy when it's going up and sell when it's going down. it's so simple when you think about it
I want give to all in the community a useful indicator to catch the big moves. I gave him the name of STS. (Snoopy Trading System) And along with your strategy I think we found the holy grail.
Very easy to follow, sell on red color buy on green color.
Properties of the indicators are by default. I will remove the indicator soon, so hurry up to download.
* Any questions feel free to ask
PS: All what I have learned was with a Ex-Institutional trader, with a very good reputation, although anonymous (he´s very humble). And yes just like me he have dogs, and like me he goes to the gym too. Well, sooner or latter I will create a website too.
{quote} Very true, well spotted, but also of note is it has to go down before it can go up and go up before it can go down. Then you buy when it's going up and sell when it's going down. it's so simple when you think about it
Ignored
yep, so thats all anyone needs to know and then don't piss your pants once you have bought or sold and don't cry like a big girls blouse if you lose.
Does make you wonder what percentage of this site is utter crap though
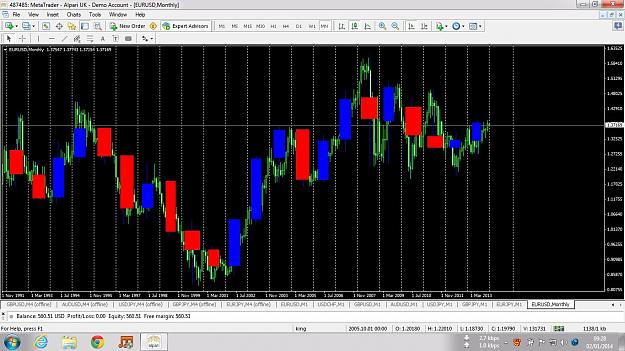
here's a nice example, price was going up and then it went down, so sell. No lines, fibs, pivots or any of those other fanny pads traders seem to love
{quote} yep, so thats all anyone needs to know and then don't piss your pants once you have bought or sold and don't cry like a big girls blouse if you lose. Does make you wonder what percentage of this site is utter crap though here's a nice example, price was going up and then it went down, so sell. No lines, fibs, pivots or any of those other fanny pads traders seem to love {image}
Ignored
Without seeing a larger chart I don't know but purely based on that one and nothing else - which means NOTHING, if I was long off the bottom it was a good place to take profit. Then wait. Then re-load with larger size off the bottom.
If you are wrong about direction more than 50% of the time stop trying to guess direction, keep trading in the same direction until you have a clue what you're doing. You'll trade less and you'll make less mistakes. The market goes up or down from where in which direction and how far is pure educated guessing.
Make your complete cluelessness work in your favour.
That's what the banks do, along with the 50, 100 and 200 MAs of course which don't correlate with anything because they're old stock market numbers from a looooonnnnnnnnggggg time ago and may just only apply when looking at a certain chart and not others (doh!)
286 might be the more accurate magic number for the XXX