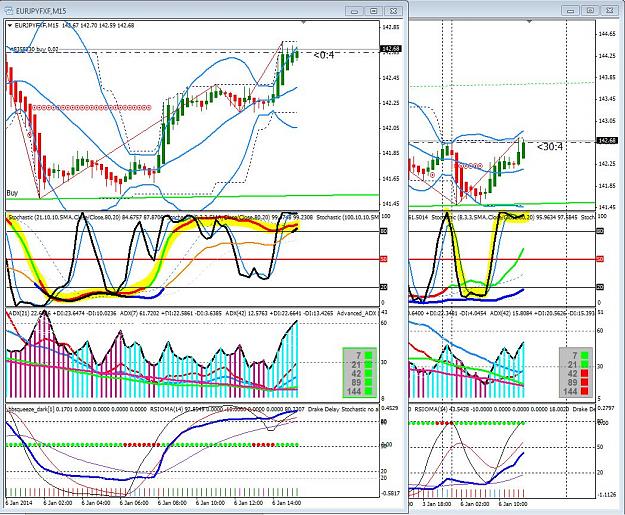
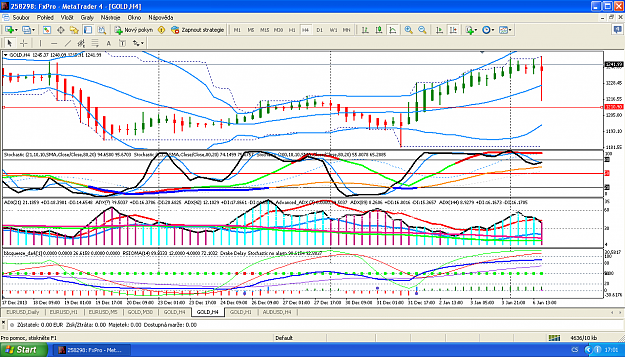
Disliked{quote} Here is what I think: D1: RSIOMA staying above 80 area, long; ADX 7 and 21 losing power, but 42,89 and 144 still powering up; STOs: Although 8,3,3 going down, 21,10,10 and 100,10,10 are still above 80 area. H4: only time frame bothering me. RSIOMA: below 50 area but turing up; ADX: All speeds except 89 pointing up; STOs: 8.3.3 going up, 21.10.10 turing up, 100, 10, 10 staying above 50 area. H1: RISOMA about to entering above 50 area; ADX: All 5 speeds powering up; STOs: 8,3,3 above 80, 21,10,10 and 100,10,10 turing up but still below 50....Ignored
the daily 8,3,3 sto that is below 20% line can be like the rsioma DS divergence trade, where it will come back to the 21,10,10 and other sto since they are flay in the over 80% area. confirm with lower time frames if and when you see the turn happening.....
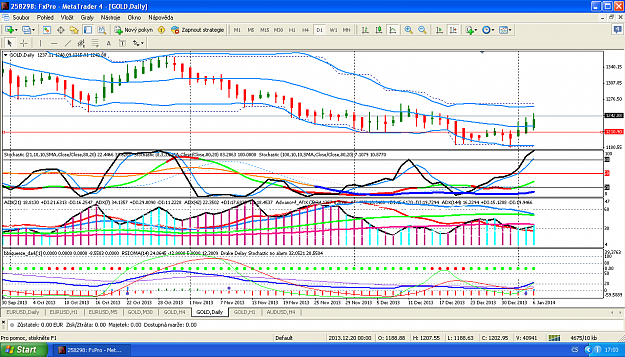
TIP: Imagine the H4 RSIOMA as the 8,3,3 sto on the daily ......as the rsioma on the H4 turns long , so will the 8,3,3 on the daily.............
Aliens looks at things Out of the Box and sometimes (not to confuse people ) corresponding indicators in other time frames, line up giving you even more confidence in a trade.
I will show you an example in the next post how I see the waves from one time frame to the next using the stochastics window, ............
The More You Learn, The More You Earn.....
1