Joined Dec 2010
|
Status: Foook Bollinger-dr.Kegel knows!
|9,744 Posts
Monthly on a hundred could mean over 1000+ pippers still in the trend. Am I right?
I would focus when currency is strong just to buy it. So closer to 100 better a buy..
Im also experience this sort of questions..
The biggest question is, how one filters trades out.
Monthly on a hundred could mean over 1000+ pippers still in the trend. Am I right? I would focus when currency is strong just to buy it. So closer to 100 better a buy.. Im also experience this sort of questions.. The biggest question is, how one filters trades out.
Ignored
perhaps but we need more specifics...need to do some testing to see how long a 'signal' (say a currency hitting 0/100) stays there before it comes down. drawdown on trading MN1 signal could be huge.... but these are good starting ideas we can build on.
{quote} perhaps but we need more specifics...need to do some testing to see how long a 'signal' (say a currency hitting 0/100) stays there before it comes down. drawdown on trading MN1 signal could be huge.... but these are good starting ideas we can build on.
Ignored
Im already in this kind of strategies for some time now and I can say that with 8 currencies which hanovers masterpiece is into, you have too much pairs and plays potentially in a play. Im focused on 21 pairs and 7 currencies. I dont play NZD. But this is not really a problem.
What Im experiencing is and what you will surely be ready about:
1. Problem of backtesting. You cant backtest this as it looks for all the market.
2. Lots of noise in the strategies: Lots of orders as 21 pairs is really a lot.
3. Lots of forward testing. (Im not a programmer, but found excellent one on FF. I managed to picture one EA with multiple scenarios, so I could forward test it to oblivion. I recommend this). In the peak time of testing I had 4 computers running with 100 EAs running im in the 4th phase now, so really dont need the pawar anymore..
4. Lots of ideas which were scratched in different phases of forward testing. (Mainly on TFs and values) (my indexes dont have 100-0 ratio, but are freefloaters).
5. I am purely concentrating on % winning rate with R:R around 1:1 and higher. The goal is over 70 percents.
thanks for the heads up 21. yes, i could see eliminating CHF as well as NZD due to their correlation with AUD & EUR. sounds like you are basket trading. do you find better results vs. discretely trading only the strongest/weakest currencies ? do you prefer trading the reversion from extreme RS levels, or momentum trading the RS signals ? how much does MTF work into your system(s) ? e.g. have you found advantages to analysing more than one TF, or does the redundancy make it not worth it i am working out strategies in Excel, to spit out trade recommendations...
Ignored
Yes, its not the problem which currency to get rid off, but how to filter the trades. So, higher number of pairs wont hurt, if one filters them out. The problem is thru testing period as there are larger data set on statistics of the results. When one comes down to less than 100 trades a month from 10k that is achievement. Not there yet.
No basket trading. 21 pairs. Index trading. Looking for strongest and weakest and try to buy the strongest when is the weakest and with the strongest currency at that time, which is weak.
My indexes are different than ones here. I use two speeds of them and use all TFs. Also a different indicator. David is using stochastics, im using MA. Also mainly all TFs in the decision making.
I wouldn't go and try to find a system which is contra trend. So, trying to join in the momentum.
What is MTF? sorry, dont know. -Monthly TF? No.
Backtesting and looking at the values:
The problem is, that when you set numbers (speed) of data to track you already are making strong decision. Also for the past. So past is worthless over the X time back. Lets say you pick 10 as a Speed.
It will look 10 TFs back from NOW. Then you try to get that whole idea into excel. But, results are not true. As 11 days back or also yesterday, results were different. So getting data back is also difficult. It repaints..at least mine does, David could say something about that.
agree, these RS indi's repaint. because they are constantly putting the newest data point into the chosen number of data points (e.g. 20 periods back,or what have you) and recalculating the whole range. thus i am also coming to the conclusion that only the most recent data points are important for signals. but that is all that is needed i think. we are concerned with which curr is stronger vs the others at this moment and across multiple timeframes (MTFs) ...not what it did in 20 periods ago. that said, looking at the larger data set of say >3 periods IS proving useful for visual backtesting. i see some good matchup between reversals on price charts and the RS extremes (large difference btwn 2 currencies) and also crossovers.
on stochastics (ROS indi): it probably makes the most sense to approach this indi as you would use a stochastic. as david cautioned us this in his original post, just because a curr is strong/weak on the stochastics (even vs other currencies, not just its own stoch) doesn't mean it won't park there and remain strong/weak. so unless there is some other kind of filtering, that sort of eliminates looking for entries based on reversion using the ROS.
>>I wouldn't go and try to find a system which is contra trend. So, trying to join in the momentum.<<
playing the reversion from 0/100 on the RS indi is not necessarily contra trend, if the larger TFs agree. also, if a curr is at 100 vs. the others it is most likely to not remain on top for long. this cries 'possible entry' for me.
whereas i think stochastics, which indicates ob/os, tells you better when a move has run out, at least in the indicated timeframe. this speaks 'conservative (or first TP) exit' to me.
anyway this is where i'm at in my using these tools so far. good stuff.
on repainting: setting ROS to 3 periods vs 30 periods turns out pretty much the same numbers for the first 3 periods. it may be that the older values (beyond 3 periods back) are more sensitive to the repainting changing their values.
note - the repainting 21 is talking about is about seeing entirely different numbers based on when the chart starts. this seems more important with RS than ROS. this can be set using the Base Point parameter in the RS indi.
...playing the reversion from 0/100 on the RS indi is not necessarily contra trend, if the larger TFs agree. also, if a curr is at 100 vs. the others it is most likely to not remain on top for long. this cries 'possible entry' for me. whereas i think stochastics, which indicates ob/os, tells you better when a move has run out, at least in the indicated timeframe. this speaks 'conservative (or first TP) exit' to me. anyway this is where i'm at in my using these tools so far. good stuff.
Ignored
Everything goes, yes. Later on one needs a high number of trades with good % winning to say that one is up to something.
I am very interested also to run along with some ideas if you guys try to build something. But Im ultra weak at programming, so Im a useless fook in that territory.
Dear Hanover,
i am looking for a supply & demand trend(zones) indicator, for all time frame for major pairs. on single chart like dashboard.
regards, hukam
Dear Hanover, i am looking for a supply & demand trend(zones) indicator, for all time frame for major pairs. on single chart like dashboard. regards, hukam
Ignored
Hi,
That sounds like a big programming job, and I'm currently too busy with existing projects to undertake anything that's too time-consuming. If you post your request in one of the ‘I code your EAs/indicators for free’ threads, it's more likely to be seen by other programmers, and perhaps one of them will help you. But you'll probably need to explain exactly how the zones are calculated; we programmers are intellectual giants but we are not mind readers. LOL.
{quote} Hi, That sounds like a big programming job, and I'm currently too busy with existing projects to undertake anything that's too time-consuming. If you post your request in one of the ‘I code your EAs/indicators for free’ threads, it's more likely to be seen by other programmers, and perhaps one of them will help you. But you'll probably need to explain exactly how the zones are calculated; we programmers are intellectual giants but we are not mind readers. LOL. Good luck, David
@hukam
try this, it's excellent at drawing Sam Seiden style supply & demand zones. i liked this so much at the time, i supported the developer.
<end of off-topic>
@hukam try this, it's excellent at drawing Sam Seiden style supply & demand zones. i liked this so much at the time, i supported the developer. <end of off-topic> {file} {file}
The accuracy of this indicator is actually pretty good. The first indicator from hanover to actually run on my platform. I've tried one another before - sessions and it didn't run. Keep doing the good work, man!
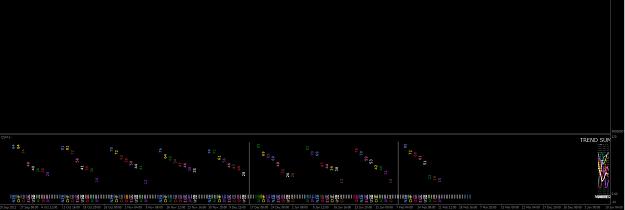
Latest version of CSM is attached to this post. The indicator now includes a 'Trend Summary' feature which is enabled if you set SummarySpacing to a value > 0. The summary plots all of the CSM values for each TF as a line graph, allowing you to quickly view which currencies are strong across several TFs (colored line is above the midpoint in consecutive TFs) or are becoming stronger (colored line slopes upward). Vice versa for weakness. See screenshot (this uses the default parameter settings). For example, one possible use might be: find a pair...
Ignored
Hanover,
I'm wondering if something is missing? I installed only the indicators you have from your post #541 as instructed. I've also installed the fonts from post #547, but still nothing. Am I missing something? Maybe something from an earlier version? My MT4 build is 509. Thank you
{quote} Hanover, I'm wondering if something is missing? I installed only the indicators you have from your post #541 as instructed. I've also installed the fonts from post #547, but still nothing. Am I missing something? Maybe something from an earlier version? My MT4 build is 509. Thank you {image}
Ignored
MK,
I don't believe you're missing anything. It should merely be a case of installing both the indicator and the font.
This looks like exactly the same problem described in posts #547–550, where both hukam and djarum11 say that installing the font fixed it. There is possibly some setting on your computer that's different to both theirs and mine. Or perhaps it's necessary to exit and restart MT4, or even reboot the computer, to have MT4/Windows recognize the new font? I'm not sure. Sorry I can't be of more help.
i am working out strategies in Excel, to spit out trade recommendations using other filters/indicators as well as RS. cheers
Ignored
@everybody:
Just a note that RS (if you set SmoothingSMA > 1) and CSM are lagging indicators, in exactly the same way that moving averages are: they gather past data and plot an average of that data. To reduce the lag, you can always move to a lower TF, but then you pick up the lag from a shorter cycle.
Similarly, ROS lags in exactly the same way that stochastics do.
Re "can strength indys be used profitably?": The key underlying question is whether pairing strong against weak on a given TF will (on average, and everything else being equal) unearth longer trends than simply trading a pair that's effectively randomly chosen. If the answer to that question is "no", then these indicators are effectively worthless. While I don't believe that's necessarily the case, IMO they work better on longer TFs (H4 upward) and need to be partnered by a solid strategy for timing entries and exits.
I have a friend who posts the results of his own daily strength/weakness analysis on another forum. I've backtested a "vanilla" method where we simply sum how many pips price has moved in his predicted direction on the pairs he chose: 12, 24, 36 and 72 hours after his calls are posted. By "vanilla" I mean that there is no complementary strategy for timing entries and exits, it is purely a test of directional bias. The result (over approx 1600 s/w calls across an 11 month period) is that the s/w analysis offers little better than a breakeven result over all 4 tests (12, 24, 36, 72 hours), although it tends to work better on certain weekdays (best: Fridays; worst: Mondays) than others.