Hi zoomzoom
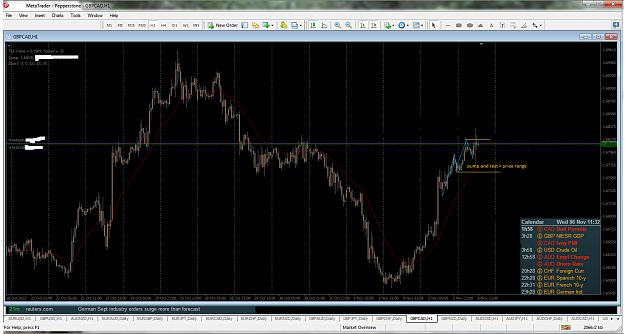
I am also from a non economic/banking background, I too thought that the market structure was beyond me at first, a while back I was banging on about buyers and sellers relationship and how they could show themselves in the market chart format, in my pursuit on this subject I believe it has helped me start to understand some of the market structure and how it shows itself within the charts, for example, I asked myself questions about why do the markets and charts move the way they do? What am I missing that the successful traders are seeing? I forget what I posted now, but fti said to me the market ‘pumps then rests’, after thinking about this and watching the charts for a long more time, I started to see this ‘pump and rest’ action, while re-reading this thread I then started to see and visualise the actions of the banks/ brokers/tiers and how if they have a run on a currency they would wait for the ‘run’ to stop/slow and try to re-balance their books during this period, I started to see what the effects were if the run continued, the market lost interest or if the other side started to trade during this ‘rest/re-balancing’ period, putting it together I could start to understand the ‘pump and rest’ (correctly I hope?), this got me thinking about how the really big trades are past through the tiers and I realised this could be connected to the big 3 pumps/rests of Elliot wave, fibs and so on, this got me thinking of trying to map this movement (not Elliot wave/fibs, the pump and rest) when I did I saw a bit more all in real time without having to worry about using the t/a that is forced upon us when we start and still I am seeing more, you can add things to the mix like watching the overall movement of a currency throughout all its pairs trading the one/s with the best/easiest to read structures (though I have not really got the full hang of this part yet).
It is not as simple as I have made it sound, it takes time/lots of screen time and re-reading this thread to start to see this and it is rarely the same, it can often be similar so that is what i look at/for, what the market price structure is telling me NOW and where we are at within the pump/rest move/s of NOW, whilst taking the bigger picture into account, personally I find it a lot easier to see this in the line charts, but that is just what suits me, again this is just my experience of what I have found, I am sure there are other ways that work well too.
Regards
Phil.
-be careful about what you allow to be put in your mind-