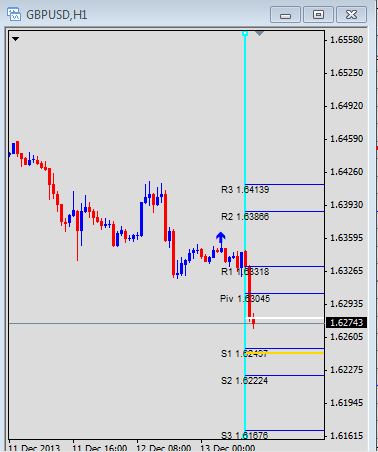
Base pivot point=(High+Close+Low)/3
Support 1= 2*Pivot-High Resistance 1= 2*Pivot-Low
Support 2= Pivot-(R1-S1) Resistance 2= Pivot+(R1-S1)
Support 3= Low-2*(High-Pivot) Resistance 3= High+2*(Pivot-Low)
I found this laying around somewhere collecting dust,but in order to calculate this formula right will be if 2 consecutive up closes occur in a row we measure the distance between the close and high of each bar,if the distance between the close and the high of the most recent bar(that just closed) is greater than the close to the high of the previous bar then use the most recent bar's High and Close in base pivot calculations,and the Low we use is the Swing/Demand Low,off these 2 bars the Support And Resistance can be made.
And Like wise If we have 2 consecutive down closes we will measure the close and the low of the current bar(that just closed)and the close to the low of the previous bar,If the distance between the close and the low of the present bar is greater than the previous bar then use the most recent bar's Low And Close in base pivot calculations and the HIGH we use is the Swing/Supply High,off these 2 bars the Support And Resistance can be made.
Hopefully I explained it correctly I left out a couple of words on purpose and Swing High,Supply and Swing Low,Demand I know sounds discretionary but keep in mind this calculation is not meant for anything under the 1hr chart which most people can spot what I simply call the candle that starts the move,please feel free to ask anything if needed to complete this thanks Max
Attached File(s)
One Must Use A Noble Rapier To Pierce The Veil Of Mystery