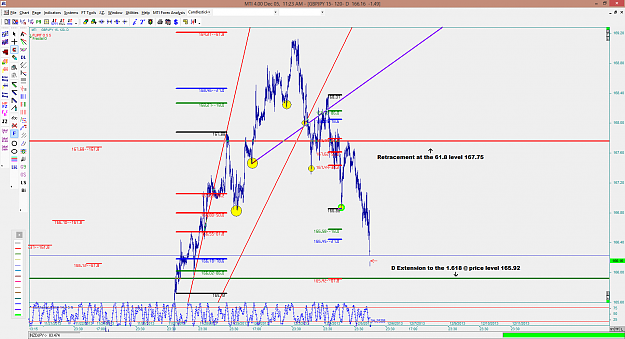
Disliked{quote} Direction is not predetermined without fail. Ultimately it's always order driven. We are facing a strong bull run and yesterday's price action suggest that we could be looking at a pullback that started in the 169 area. After a 1000 points run up it's very likely that a few stop (sell) orders have been building up below yesterday's low at 167.30ish and 167 the figure and it's also likely that these orders outnumber buy stops to the upside at these levels. This of course might change as we get more news, data and some of those orders are...Ignored
FYI, 114 weeks ago this week, GJ began to set up a reversal pattern that was 1662 pips in height. It broke out and finally retested it in November 2012 at 125.64 By the time it had reached 169.13, it had traveled (to the nearest 5 pips) 4350 pips. When you multiply the height of that reversal pattern by the Fibonacci multiple of 2.618 and apply that to the break out point, you arrive at (again, to the nearest 5 pips) 4350 pips. Those number etc also coincide with wave theory, but I figured that anyone could get their head around and be a little more accepting of simple arithmetic.
Predetermination, magic or sheer coincidence? I have no idea. But where it stopped, it not only met a very long term trendline (dating back to 2000 at 148.5 that broke in 2008 and was retested twice in 2009 at 163), as well as the monthly 100 sma.
Possibly it will progress further, but thems the facts so far.
Regards