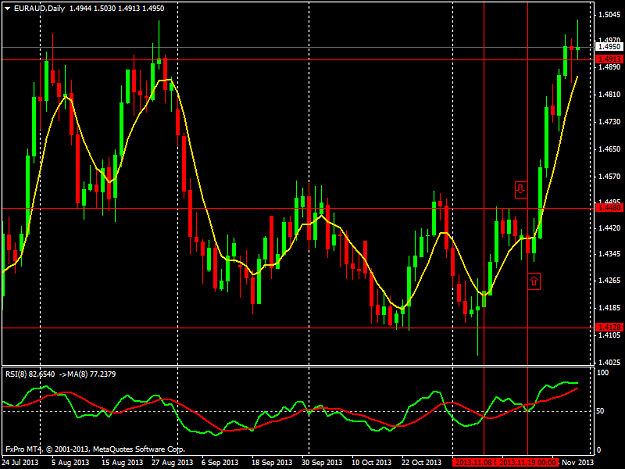
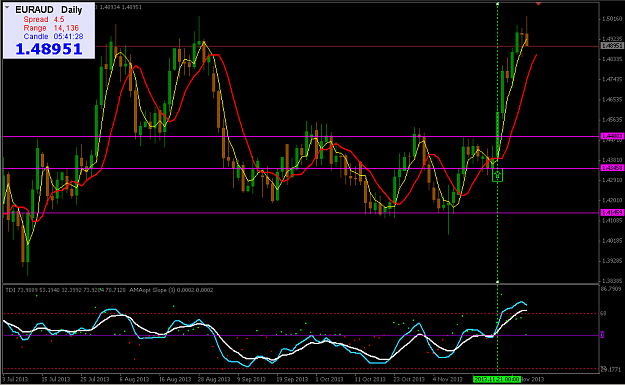
As I said 3 - 7 day reversal patterns that close the other side of the 8lwma.
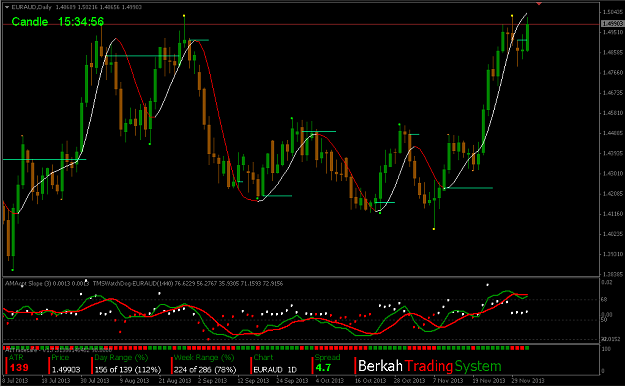
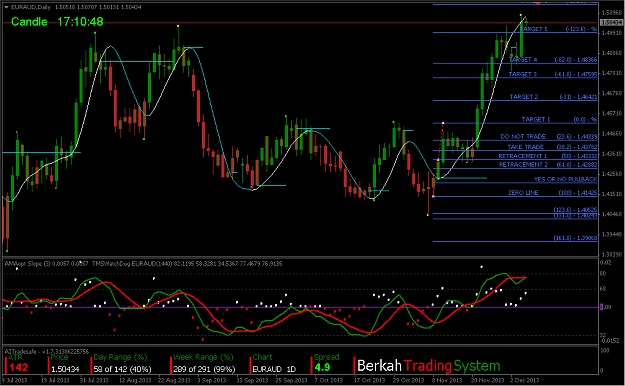
See 8 Nov. There is an identified support level 1.4128 at the Oct lows and you don't know in advance if it will hold or fail in Nov. There is a massive doji (caused by news but that doesn't matter) and the following day a positive close for a 4 day reversal. Now if your view is from 11 Nov you are looking to buy then you go to your 1hr charts (if that's your entry TF) and look for solid trades.
Price pushes up to the 1.4480 area that is also a SR level going back to July, Aug. Again you don't know what will happen there but its a 250 pip run after the D signalled buy focus.
A little trickier is the D close on 19 Nov that you'd be expecting to sell for a fall back to 1.41.
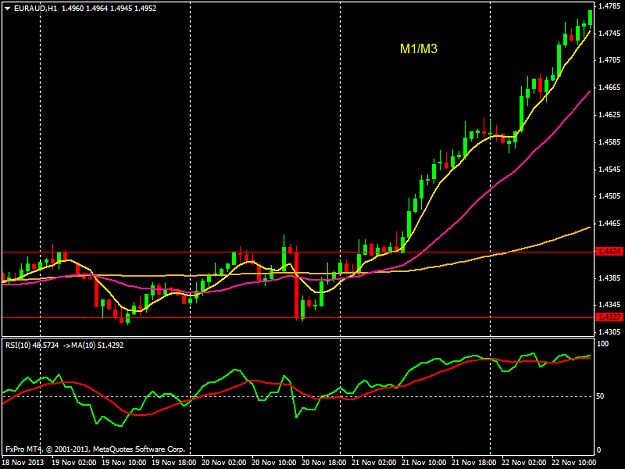
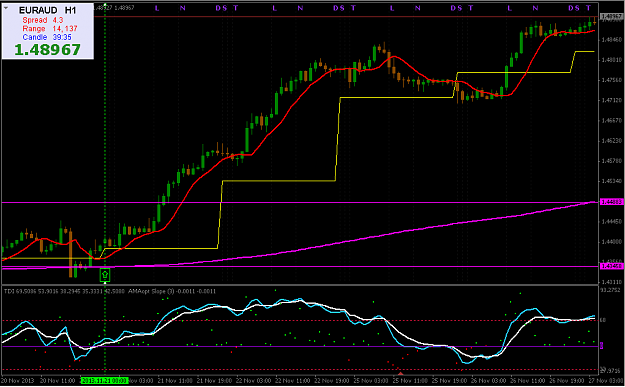
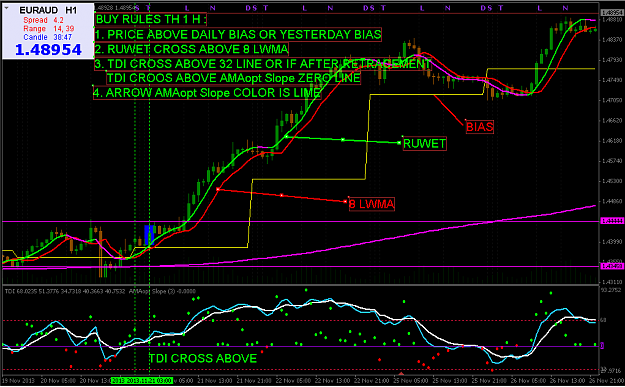
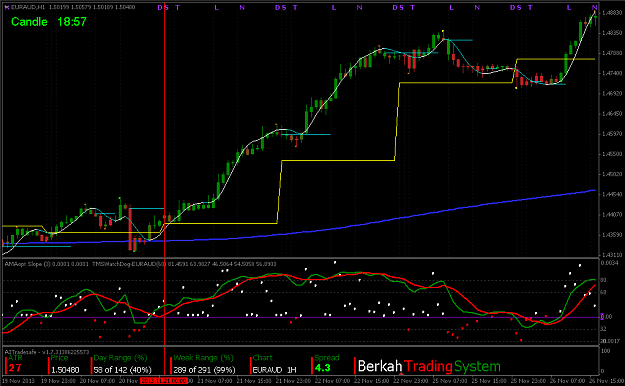
Lets have a look at 1hr. Here you'd have to have a look at your indicators that you intend to use. But what you can see on 19th is that US session did not follow through London opens move lower. If this is a downtrend why not?
On 20th 1hr Asian session took euraud up. Make no mistake if Asian session wants to move this pair big time they will. So again why not lower? Perhaps these are very difficult questions to answer and hind sight from a chart is perfect. Price moves up to 1.4424 and gives a sell signal with an evening star pattern. That's a trade as D suggests down and you have moved lower from a resistance level. On my charts if I were to sell there I'd be cautious as I am above my purple and brown lwma's that tell me I am above the equivalent of my 4hr and D 8lwma's. Not the stuff that down trends are made of. You need to look at your indi's and see if they would have given you a warning that this trade might not have worked.
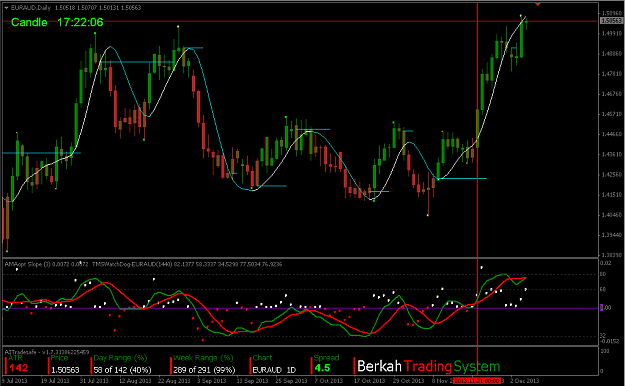
Then with the 20th closing positive the focus is back to buys on 21st. Then you are hoping that your method will minimise losses on 20th and as trend now back up give you bigger trades from 21st when its back to buying.
Hope it helps.
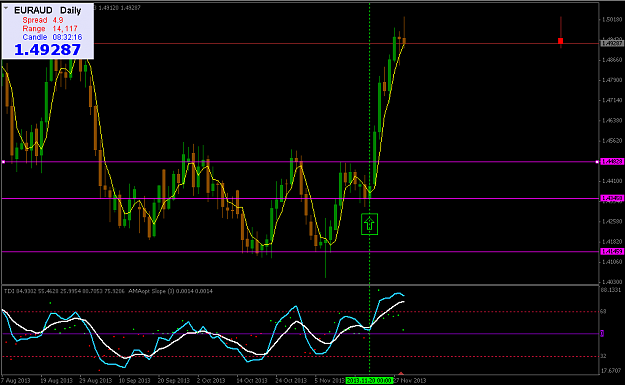
See 8 Nov. There is an identified support level 1.4128 at the Oct lows and you don't know in advance if it will hold or fail in Nov. There is a massive doji (caused by news but that doesn't matter) and the following day a positive close for a 4 day reversal. Now if your view is from 11 Nov you are looking to buy then you go to your 1hr charts (if that's your entry TF) and look for solid trades.
Price pushes up to the 1.4480 area that is also a SR level going back to July, Aug. Again you don't know what will happen there but its a 250 pip run after the D signalled buy focus.
A little trickier is the D close on 19 Nov that you'd be expecting to sell for a fall back to 1.41.
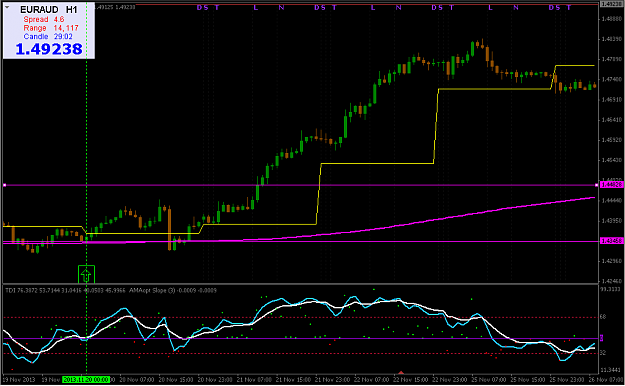
Lets have a look at 1hr. Here you'd have to have a look at your indicators that you intend to use. But what you can see on 19th is that US session did not follow through London opens move lower. If this is a downtrend why not?
On 20th 1hr Asian session took euraud up. Make no mistake if Asian session wants to move this pair big time they will. So again why not lower? Perhaps these are very difficult questions to answer and hind sight from a chart is perfect. Price moves up to 1.4424 and gives a sell signal with an evening star pattern. That's a trade as D suggests down and you have moved lower from a resistance level. On my charts if I were to sell there I'd be cautious as I am above my purple and brown lwma's that tell me I am above the equivalent of my 4hr and D 8lwma's. Not the stuff that down trends are made of. You need to look at your indi's and see if they would have given you a warning that this trade might not have worked.
Then with the 20th closing positive the focus is back to buys on 21st. Then you are hoping that your method will minimise losses on 20th and as trend now back up give you bigger trades from 21st when its back to buying.
Hope it helps.
Attached Image(s) (click to enlarge)