DislikedHello AEBAB - JMSS59 - HOLLOWHEAD I am new to thread but have read it and want to make sure I understand it. I am referring to DAILY CHART in post #1 - If i understand I wait for price to go above 76 then rebound down and I would enter just below the 76 level with a take profit at the 23 level. SL would be optional and at my discretion. Then i just wait for price to go above 76 or below 23 and rebound in th opposite direction and enter the same way again If i am correct then this is one of the simplest strategies i have ever seen - Please let me...Ignored
Yes and no. There are several ways these templates can be traded. Bobi has implied you can use some of the templates to give you a direction bias and blend with your own strategies, or you can actually trade the templates.
Bobi has given 1 mt4 template, and presented several ways to use that template (he refers to each way as a template which can be a bit confusing).
Each 'template' has a length and baseline.
Each template has a set of rules - some are the same as other templates, some are slightly different. One that seems to be fairly consistent across most of them is what you a alluding to in your question.
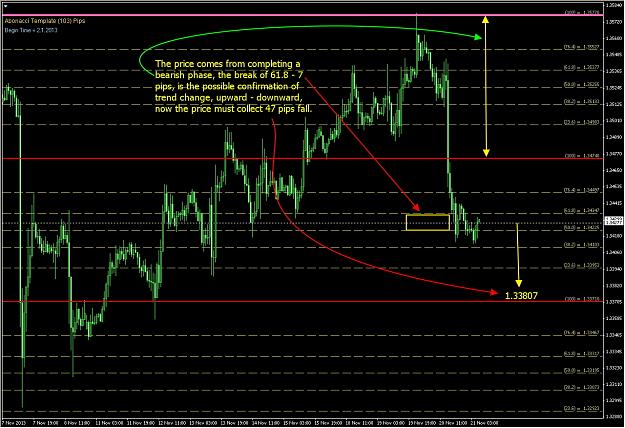
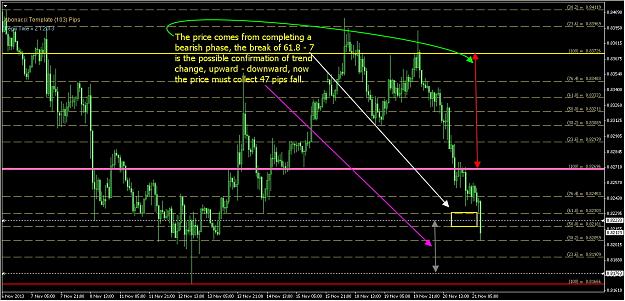
- For a short trade you want price to have come from the 23% area in the upper phase and to have come through the 0% and broken the 76% by a certain number of pips. If it breaks then it should eventually reach 23% (note I say eventually because in the template in the first posts it can take week and give you quite large DD)
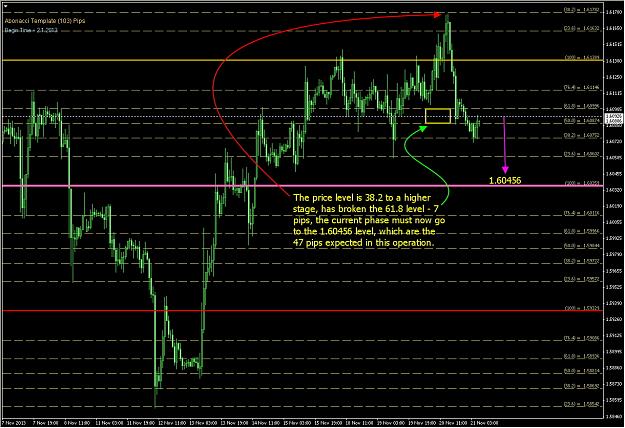
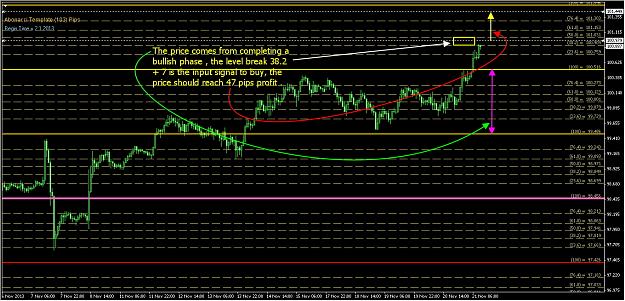
- For a long trade you want price to have come from the 76% up through the 100% and break the 38% by x pips - price will then eventually reach the 76%.
You probably want to go through find the rules for each template - they are normally bobi's posts in colour and decide how you want to use them. I have posted a few times how I use the templates together, which give me a bias and which I use for entry and exit, so you should be abel to search them out if it helps to give you an idea.
Hope that's clear.
Steve