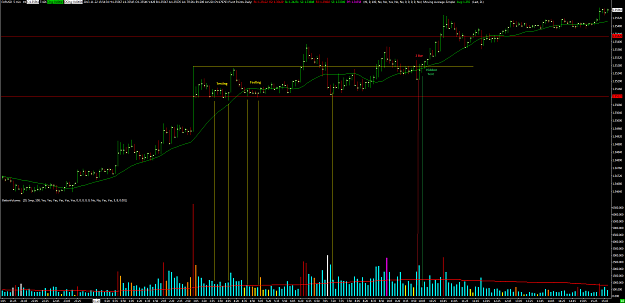
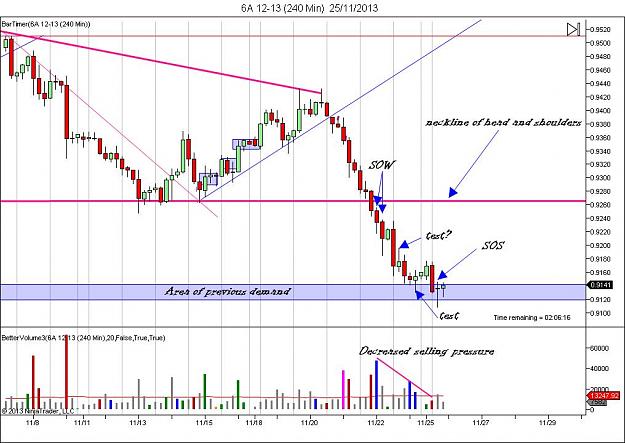
Disliked{quote} I have been thinking about this chart this weekend, a good example for trigger numbers. Using the close of the potential selling bar as a trigger number price was never able to dip below it, there was a low volume up thrust I marked in blue that could easily be mistaken for a short entry which as price comes down the market prints a hidden test right at the trigger number. Something I will explore further this week, using the close as a trigger number from the SOW and looking for entries below it. Anyone care to correct me.. Does Gavin only...Ignored
Gavin uses all three, as he states on his 1st book.
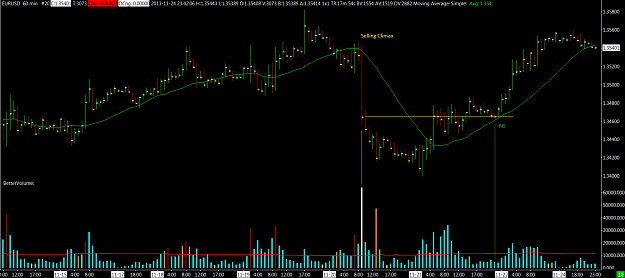
In my case, I do a bit of discretionary work on it like below:
1. if the bar has big wicks(above or below), I mark the wicks as the area where selling/buying pressure happens and this are becomes my "trigger area"
2. if the spread of the bar is narrow, I mark the entire bar for may "trigger area"
I don't really believe on one number, but a range of price action instead. And, if you think about Gavin using the 3 points, what you have is really an area, not an specific price.
When the market reacts on an specific number, well, that is a piece of beauty! :-)
Hope you all are doing very well!