Hi Hanover,
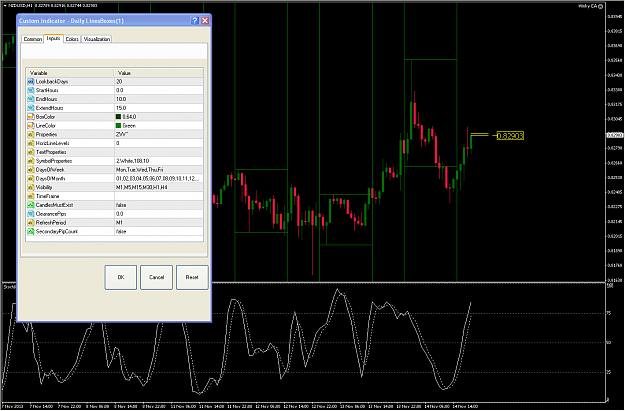
Thank you very much for your indicators and scripts. I tried to use your Daily Box/Line indicator to make a horizontal line shown in the picture, but still have no success.
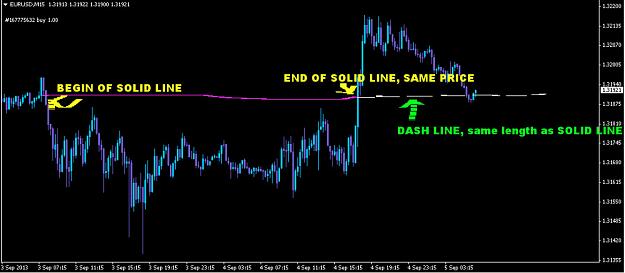
Normally a horizontal line is drawn in the hole charts, from left to right. What i want is, it will draw a solid line from a specify price, and will end if the same price level is touch. Then it will draw another dot line for the same length. Example: the solid magenta line is drawn at price 1.3192 , the price goes down. After the price goes back up and reach that level, the solid magenta line must end. This solid magenta line has 100 candles for example, so the white dot line must be drawn at the same level for the next 100 candles.
Can you give me any idea how to do this ?
Thanks
Thank you very much for your indicators and scripts. I tried to use your Daily Box/Line indicator to make a horizontal line shown in the picture, but still have no success.
Normally a horizontal line is drawn in the hole charts, from left to right. What i want is, it will draw a solid line from a specify price, and will end if the same price level is touch. Then it will draw another dot line for the same length. Example: the solid magenta line is drawn at price 1.3192 , the price goes down. After the price goes back up and reach that level, the solid magenta line must end. This solid magenta line has 100 candles for example, so the white dot line must be drawn at the same level for the next 100 candles.
Can you give me any idea how to do this ?
Thanks
Attached Image (click to enlarge)