INDICATOR CRAZY ... SOMETHING I THINK WE ALL GO THROUGH
I mentioned earlier that there was a period of several months during which I think I became indicator crazy, I think there are a lot of people that can relate. In this time I collected and developed just about every far fielded concept I could think of.
The sample belows shows a small set of the 90+ indicators I developed in that period. They were built in my search for finding and building profitable EAs although I can honestly say that I have not been able to develop profitable systems based on these indicators ... but some of the potentially profitable EAs I have built do use some of these indicators in some ways.
Note: Unlike my friend Hanover, I won't share these indicators .. why? because I think this will lead to a lot of headaches that I am not prepared for. Apart from this there are in most cases publicly available indicators that do the same things. So please don't ask.
So what is the point of showing these indicators? .. Well coming up with uniques ideas for indicators and building and testing them leads to also coming up with some very interesting concepts for trading which are not traditional ... and it's through the development of many indicators that I was able to come up with new ideas and quickly trial and back test non traditional ideas. So although in and of themselves there is no holy grail ... I think it has been an important part of the journey for me.
Note: to EA builders ... all of the indicators I have developed are EA friendly or have EA friendly versions hence they can be utilised by EAs for testing strategies.
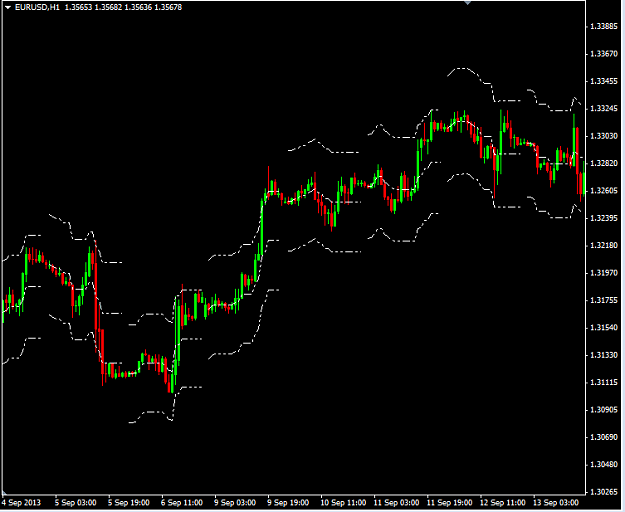
"Channel" - a non-repainting standard deviation channel which intelligently applies the channel from the beginning of the trend only.
You know when you draw a standard deviation channel and you need to set the beginning to the first candle in the trend and then you need to keep updating the channel indicator to take into account each new candle and hence know where the SD top and bottom is? Well this does it for you. It also can use any polynomial regression level - if you like a more curvy fit .. and it doesn't repaint.
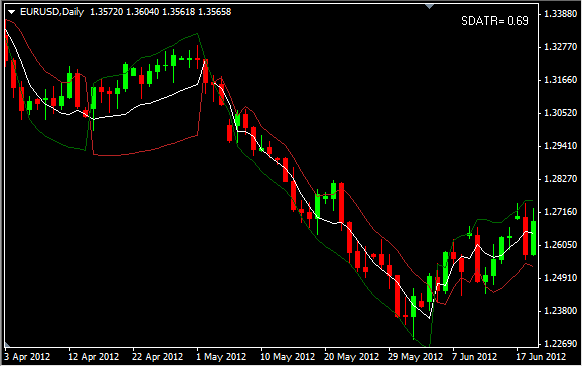
"Ranges" - Shows the upper and lower daily range based on a ATR MA. i.e. when price approaches the upper line then it means it's reached it's average daily move.
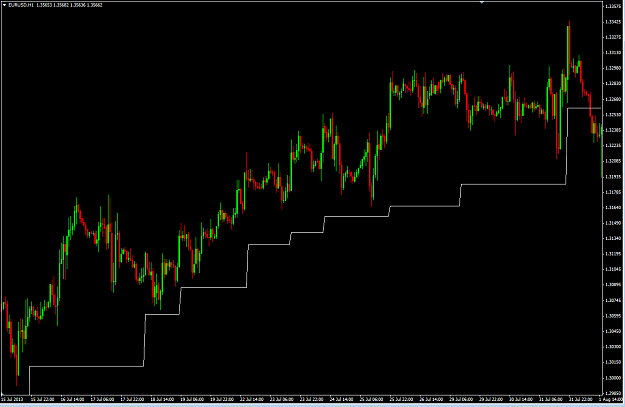
"SD Trail" - a Stop Loss trailing method that calculates Sam Seiden Supply and Demand Levels and uses them to trail price. Note: It uses my own approach to working out Sam Seiden levels.
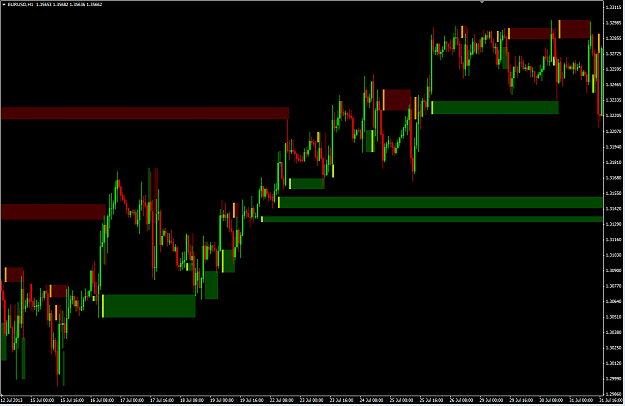
"SD" - my own implementation of Sam Seiden levels ... yes I know there are a lot of ways of working these out and no doub't someone will disagree with the levels I have shown ... but it's the best implementation I have personally used and it doesn't repaint like another well known one. These levels are fairly remarkable and I use them in my discretionary approach to trading under the right context.
Note: The levels are drawn real time on the RHS of chart .. they become invalidated and stop drawing on first touch
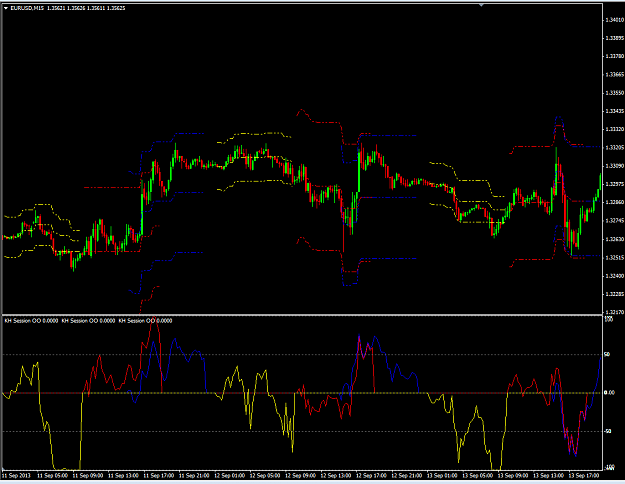
Session Ranges and Corresponding OO - Similar to ranges, but this indicator shows the ATR MA for different sessions (in this case yellow-Asia, red-London, blue-New York) as can be seen the Asian session has a much smaller range then the other two. .. on the bottom is the same data shown as a percentage of range. This indi is also daylight saving "proof".
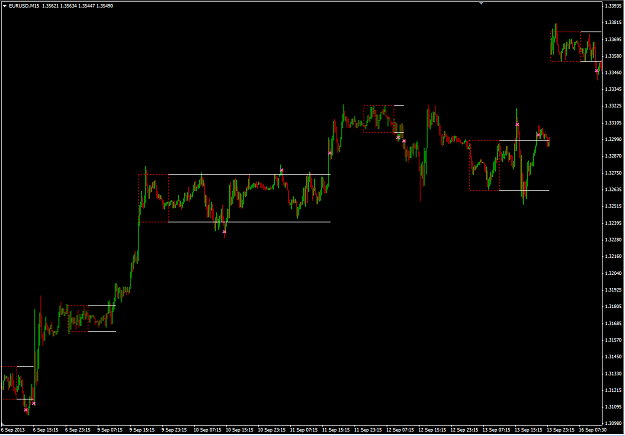
"Consolidation" .. this indicator identifies consolidation or range areas. It is also possibly one of the most useful indicators I have developed and is based on Standard Deviation.
I'll post a few more later on.
I mentioned earlier that there was a period of several months during which I think I became indicator crazy, I think there are a lot of people that can relate. In this time I collected and developed just about every far fielded concept I could think of.
The sample belows shows a small set of the 90+ indicators I developed in that period. They were built in my search for finding and building profitable EAs although I can honestly say that I have not been able to develop profitable systems based on these indicators ... but some of the potentially profitable EAs I have built do use some of these indicators in some ways.
Note: Unlike my friend Hanover, I won't share these indicators .. why? because I think this will lead to a lot of headaches that I am not prepared for. Apart from this there are in most cases publicly available indicators that do the same things. So please don't ask.
So what is the point of showing these indicators? .. Well coming up with uniques ideas for indicators and building and testing them leads to also coming up with some very interesting concepts for trading which are not traditional ... and it's through the development of many indicators that I was able to come up with new ideas and quickly trial and back test non traditional ideas. So although in and of themselves there is no holy grail ... I think it has been an important part of the journey for me.
Note: to EA builders ... all of the indicators I have developed are EA friendly or have EA friendly versions hence they can be utilised by EAs for testing strategies.
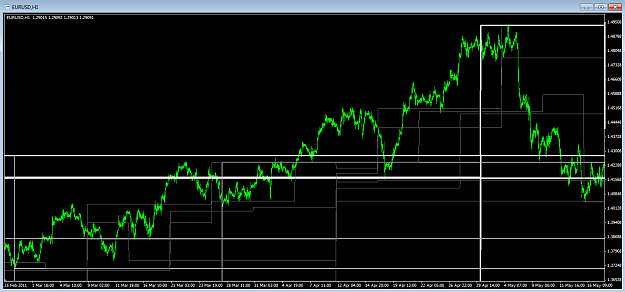
"Channel" - a non-repainting standard deviation channel which intelligently applies the channel from the beginning of the trend only.
You know when you draw a standard deviation channel and you need to set the beginning to the first candle in the trend and then you need to keep updating the channel indicator to take into account each new candle and hence know where the SD top and bottom is? Well this does it for you. It also can use any polynomial regression level - if you like a more curvy fit
Attached Image
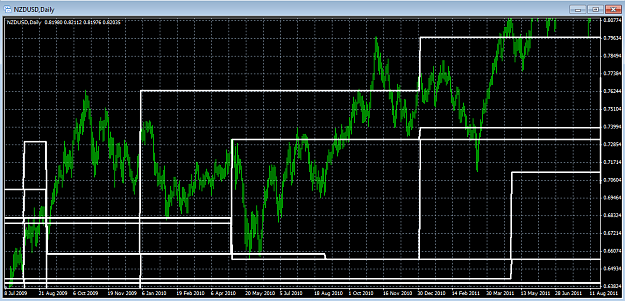
"Ranges" - Shows the upper and lower daily range based on a ATR MA. i.e. when price approaches the upper line then it means it's reached it's average daily move.
Attached Image (click to enlarge)
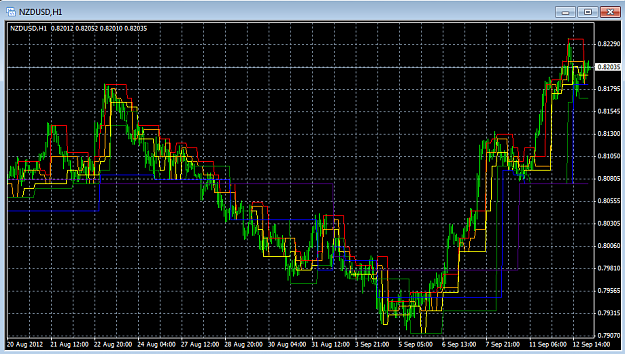
"SD Trail" - a Stop Loss trailing method that calculates Sam Seiden Supply and Demand Levels and uses them to trail price. Note: It uses my own approach to working out Sam Seiden levels.
Attached Image (click to enlarge)
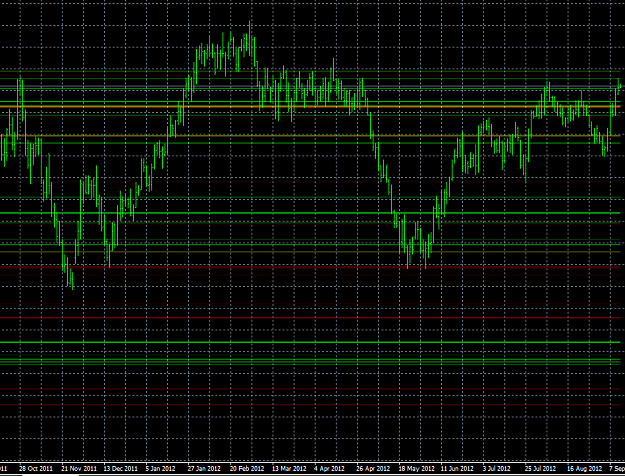
"SD" - my own implementation of Sam Seiden levels ... yes I know there are a lot of ways of working these out and no doub't someone will disagree with the levels I have shown ... but it's the best implementation I have personally used and it doesn't repaint like another well known one. These levels are fairly remarkable and I use them in my discretionary approach to trading under the right context.
Note: The levels are drawn real time on the RHS of chart .. they become invalidated and stop drawing on first touch
Attached Image (click to enlarge)
Session Ranges and Corresponding OO - Similar to ranges, but this indicator shows the ATR MA for different sessions (in this case yellow-Asia, red-London, blue-New York) as can be seen the Asian session has a much smaller range then the other two. .. on the bottom is the same data shown as a percentage of range. This indi is also daylight saving "proof".
Attached Image (click to enlarge)
"Consolidation" .. this indicator identifies consolidation or range areas. It is also possibly one of the most useful indicators I have developed and is based on Standard Deviation.
Attached Image (click to enlarge)
I'll post a few more later on.