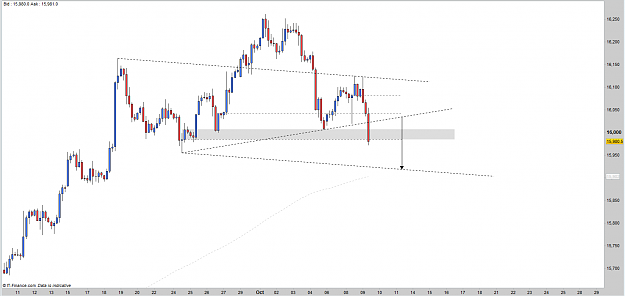
Disliked{quote} I see you use the opening price of candles to enter, that's where the big orders areThe 'long area' on my chart is 3530-3505 from the opening price of that bullish daily candle right after that bearish daily candle (at the start of that 2 day upmove) to the low of the candle...see the green area on my chart below... I think it could go down to any level inbetween that before a retrace..if there is one
Theres a daily support pivot down here also at the 3528 area. {image}
Ignored
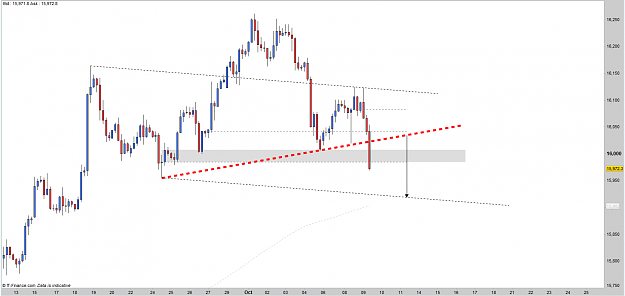
I see what you see and indeed important area on daily, it worth a try...but if it breaks it won't look good
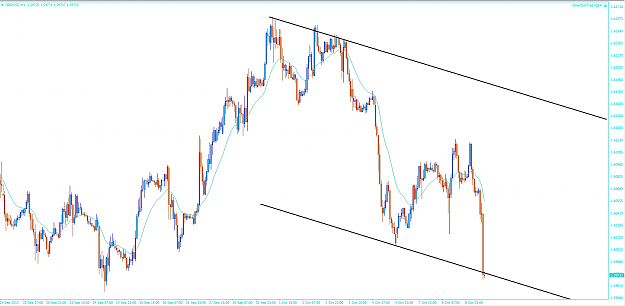
And GBP diving !
COT: The precious data ignored