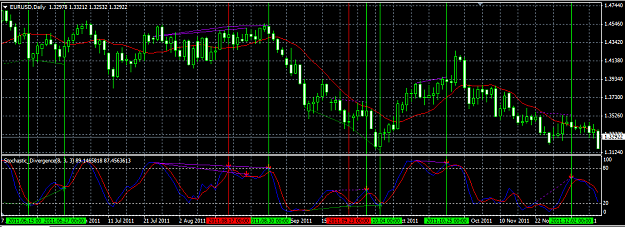
So I've picked a random time frame on the EurUsd daily chart from 20th of May 2011 to 16th of November 2011, Applied the Stochastic indicator to it and Flagged every won trade ( reached the previous high or low ) with a lime vertical line and every lost one ( stopped loss the previous high or low ) with a red line. So, I guess it's a very good winning rate on the Daily TF ... and for sure I'm gonna simulate that for longer periods and see what will happen.
Attached Image (click to enlarge)
So sorry for always replying late! But I got 2 Jobs!!