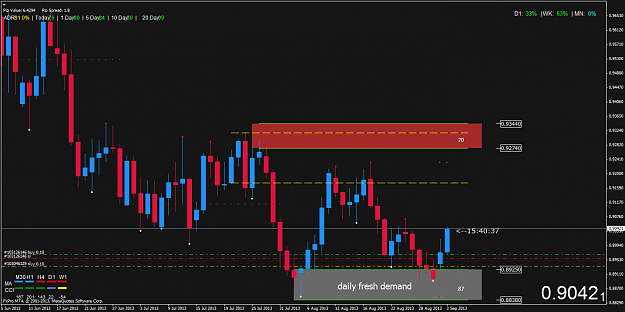
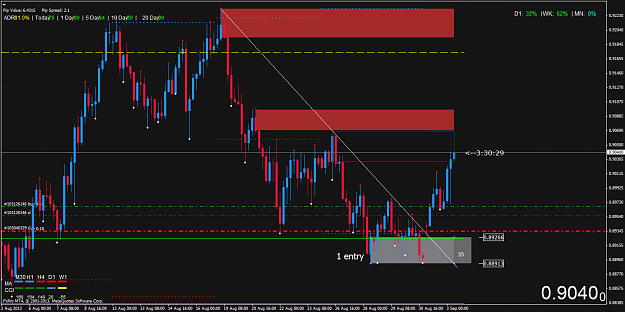
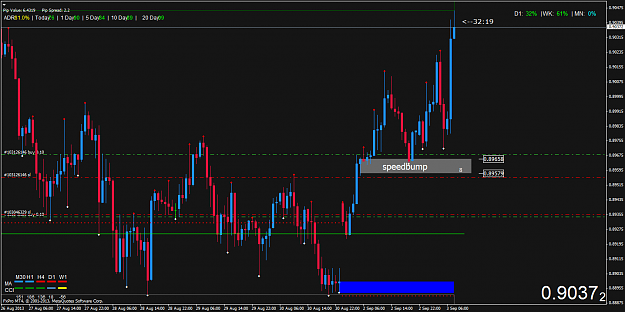
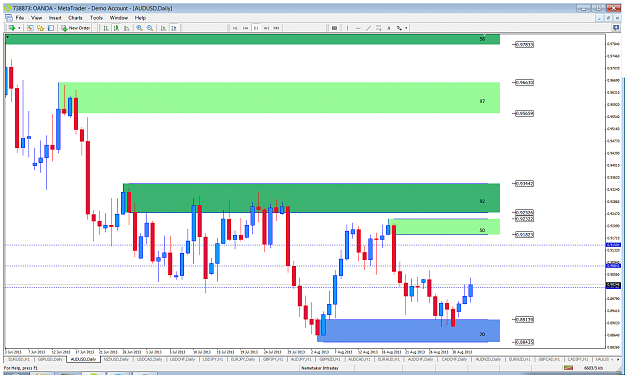
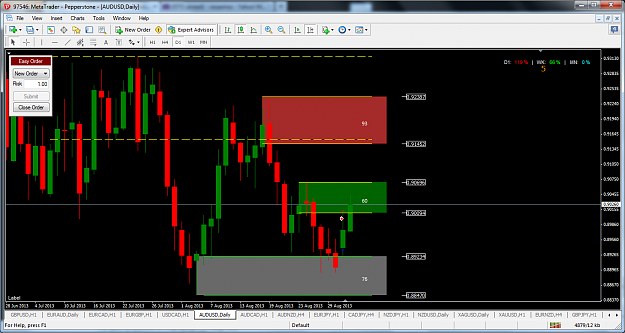
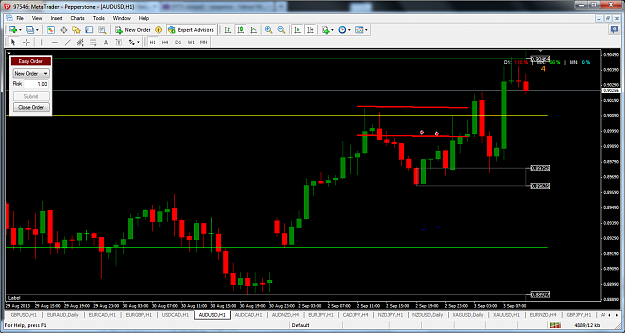
Hi there, here are my two trades on aud usd. Fresh daily demand area. First entry was due to h4 demand area. Price almost hit my sl. Second entry was at h1 speedbump. {image} {image} {image}
Ignored
welldone sekbor but remember alfonso told us not to trade during high impect news its risky .
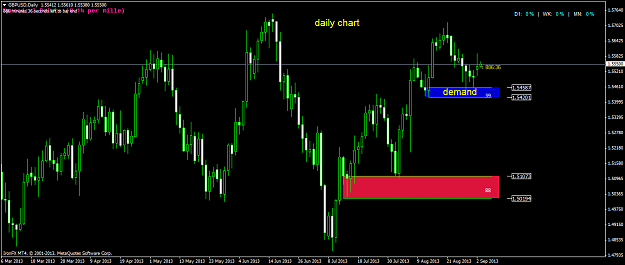
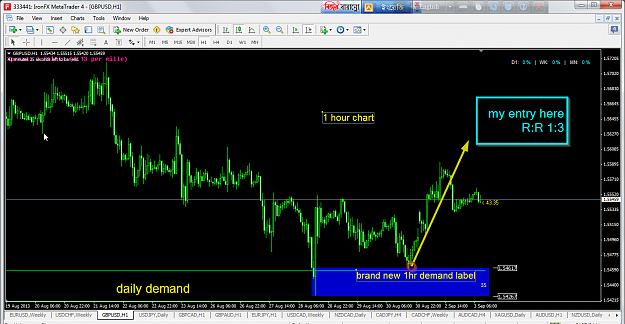
alfonso this is my gbpusd trade. a brand new demand label formed at 1 hour chart with in daily demand area and my entry was first time came back to newly 1hour demand area 1.54615 .Risk reward 1:3.done..
Hi there, here are my two trades on aud usd. Fresh daily demand area. First entry was due to h4 demand area. Price almost hit my sl. Second entry was at h1 speedbump.
Ignored
Hey Sebkor, could you tell us how you manage your TP on both of those trades? Where do you put TP if you're away from the screen, do you alter it when you're in front of the chart etc, what's the logic behind it?
Hi there, here are my two trades on aud usd. Fresh daily demand area. First entry was due to h4 demand area. Price almost hit my sl. Second entry was at h1 speedbump. {image} {image} {image}
Ignored
Hi Sebkor,
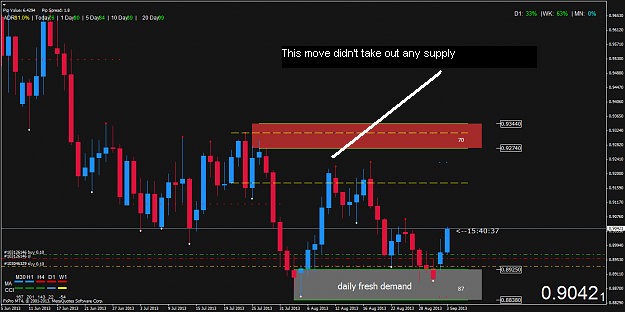
Congrats as your trades worked out very well but I have a query in regards to your daily chart and the fresh demand you have marked.
As far as I can see that move up didn't take out any supply so it shouldn't be marked as fresh demand.
What made you mark it as fresh?
Attached Image
If you act surprised, then you probably missed something
{quote} Hi Sebkor, Congrats as your trades worked out very well but I have a query in regards to your daily chart and the fresh demand you have marked. As far as I can see that move up didn't take out any supply so it shouldn't be marked as fresh demand. What made you mark it as fresh? {image}
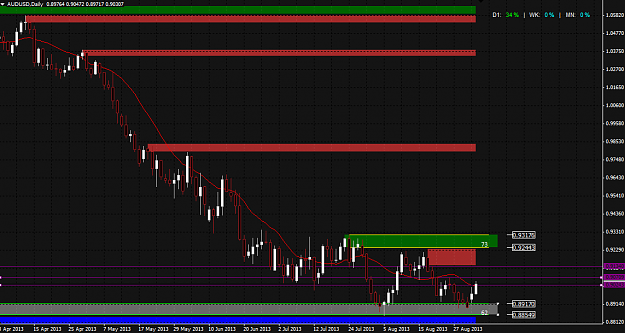
{quote} WOW, in your D1 chart, that zone is even more clear. It does have a blue candle, which is in line with the rules. Nice chart and very neat. Your charts look very clean. Nice job!
Rectangle colours:
Pale green is supply (FRESH), MediumSeaGreen is supply (UN-FRESH).
LightSkyBlue is demand (FRESH), Cornflower Blue is supply (UN-FRESH).
These are the only colors i use. I can asses a level at a glance once these basic colours are recognised.
The DimGrey level is the reaction that could not be closed above.
Price is easily breaking through Alfonso's zone, and going towards the reaction zone, which is still VALID SUPPLY as it has not been closed above, even though it has been violated.
This could also be why we have such a low win rate of successful trades. Some of the levels we are taking trades on, because we think they are new valid levels, are actually not, and the levels that are still valid in their place, are not fresh. Therefore, we are not taking trades on fresh levels.
If this is not clear, tell me and I will explain more.
I think Sebkor has been correct and Alfonso might need to change his rules. In every example, an area is still valid UNLESS IT HAS BEEN CLOSED ABOVE. Even if it has been violated completely, if there was no candle close, it is still acting as full supply/demand. We have seen too many examples of this to ignore it. here is another I just noticed on AUDUSD: {image} I will no longer be counting a supply/demand valid unless it has a full candle close.
Ignored
What i do is adjust it to the latest valley (The level is now fresh). When price pulls back into it go down to H1 and look for set and forgets or confirmation trades.
{quote} What i do is adjust it to the latest valley (The level is now fresh). When price pulls back into it go down to H1 and look for set and forgets or confirmation trades. {image} NT
Ignored
See, you may think it is your new valley acting as a supply/demand zone, but in reality, it is the old level, as price was not able to close above it.
And that level would now not be fresh, since it has technically been touched (and failed to fully close above). So taking a trade on what YOU THINK is a new valid level, is in reality, an old, unfresh level, causing you to have a lower chance at a successful trade.
Alfonso, do you realy use Supply_demand_indicator with success? Yesterday i had another loss on AUDUSD. On daily indicator located for me a daily supply, on the h1 indicator located for me a fresh levels. I'm very dissapointed. I dont know how indicator work but i've seen your video about this. I've seen as you said in video that this indicator doesnt mark speedbump. Maybe code of this indicator can help me to understand how it work.
Alfonso, do you realy use Supply_demand_indicator with success? Yesterday i had another loss on AUDUSD. On daily indicator located for me a daily supply, on the h1 indicator located for me a fresh levels. I'm very dissapointed. I dont know how indicator work but i've seen your video about this. I've seen that this indicator doesnt mark speedbump. Maybe code of this indicator can help me to understand how it work.
Ignored
The indicator marks many invalid levels that are yet to be validated. It is a bunch of a code, not a human brain.
You need to use the mind of a human to mark these zones, as they are quite subjective at times.
I'm probably going to stop using it soon and just do everything manually.
{quote} See, you may think it is your new valley acting as a supply/demand zone, but in reality, it is the old level, as price was not able to close above it. And that level would now not be fresh, since it has technically been touched (and failed to fully close above). So taking a trade on what YOU THINK is a new valid level, is in reality, an old, unfresh level, causing you to have a lower chance at a successful trade.
Ignored
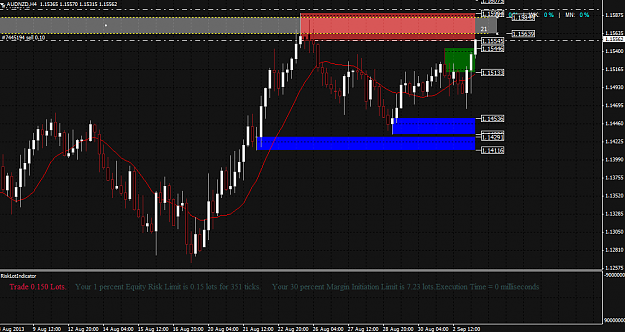
AUD/USD Example. Demand has been absorbed at that level you showed. Price is reacting to the buy orders at the level below your grey one. It just doesn't make sense to me to draw a level that has been absorbed, because the buy orders no longer exist at that level. But again, do what works for you.
Where the level stopped short of the blue one (on your chart) i would mark that as fresh and take the first pullback. Price seemed to react accordingly in the example.
Hi there, here are my two trades on aud usd. Fresh daily demand area. First entry was due to h4 demand area. Price almost hit my sl. Second entry was at h1 speedbump. {image} {image} {image}
Ignored
Congratulation Sebkor6! I dont understand why daily demand was valid? It not taken out any supply
Alfonso, do you realy use Supply_demand_indicator with success? Yesterday i had another loss on AUDUSD. On daily indicator located for me a daily supply, on the h1 indicator located for me a fresh levels. I'm very dissapointed. I dont know how indicator work but i've seen your video about this. I've seen that this indicator doesnt mark speedbump. Maybe code of this indicator can help me to understand how it work. {image} {image}
Ignored
I always use the manual rectangle indicator to draw levels. It makes you good at drawing levels fast, rather than relying on something else. I have probably drawn a thoulsand levels and i am only just "getting it" now.
{quote} AUD/USD Example. Demand has been absorbed at that level you showed. Price is reacting to the buy orders at the level below your grey one. It just doesn't make sense to me to draw a level that has been absorbed, because the buy orders no longer exist at that level. But again, do what works for you. Where the level stopped short of the blue one (on your chart) i would mark that as fresh and take the first pullback. Price seemed to react accordingly in the example. NT
Ignored
Yes but remember, price can touch a level and pullback more than once, even if it isn't wise for us to take the second/third/fourth, ect, pullbacks.
Orders may be gone, but who is to say that orders were not initiated AGAIN at that level? Remember, Alfonso commonly says that we are dealing with market makers who use computer programs. What would a computer program have against initiating another order in that location?
And traders commonly wait for close candles to confirm a level has been properly broken, so it is logical to assume that they would place new orders there.