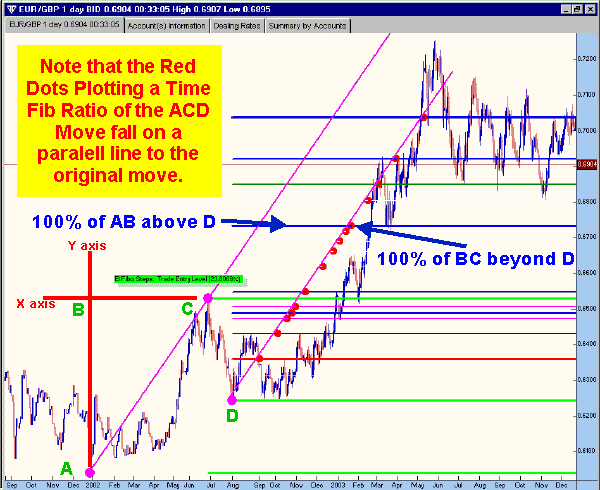
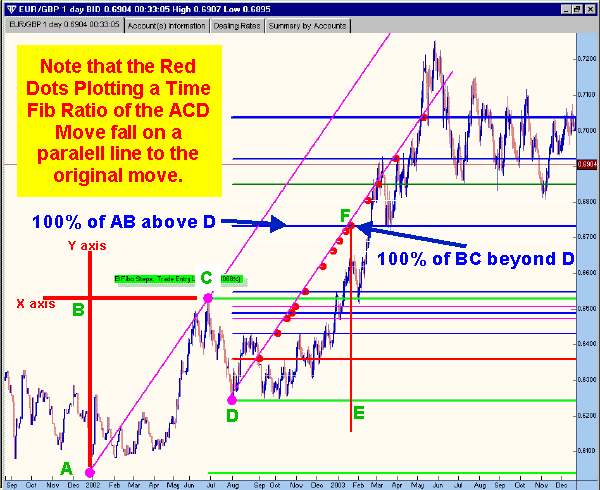
Hey all, as well all know the amounts of techniques, methods and studies on price action is both extensive and confusing and certainly there is no need to go into that here. What is becoming more and more clear to me though is that we are really only looking at half of the picture. Think of your charts, we have an x axis and y axis, price on the y axis, and time on the x axis. My question is why are we focusing only on one axis, i.e. the y axis (price), and over all, not spending as much time analysing the other half of the picture, time.
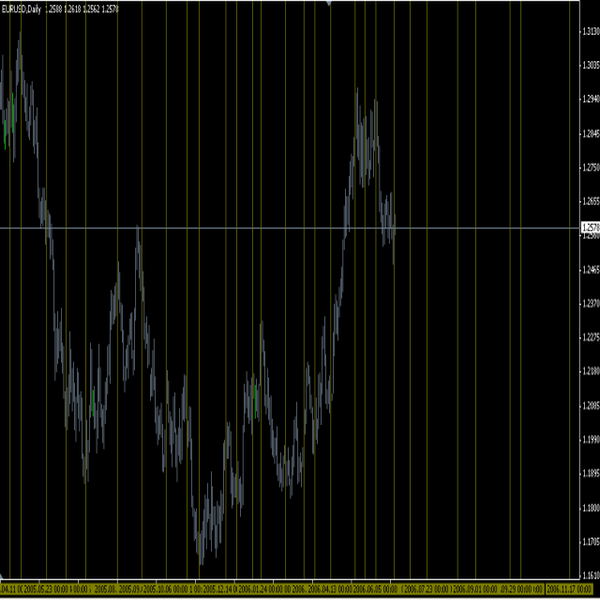
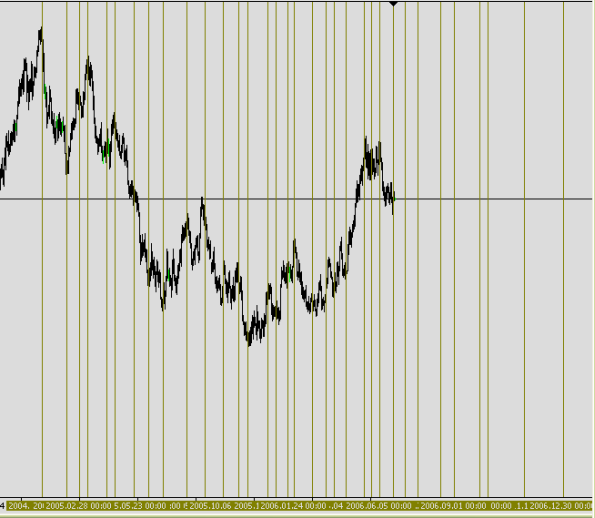
So I thought it might be a good chance to start a thread where we can look into time anaylsis, things like cycles, fibonacci timezones, harmonic beats etc and see if we can't make a few discoveries along the way. It can be very simple things, for example, pull up the 1H EUR/USD, and measure 40-45 bars from a major high or low.
So I thought it might be a good chance to start a thread where we can look into time anaylsis, things like cycles, fibonacci timezones, harmonic beats etc and see if we can't make a few discoveries along the way. It can be very simple things, for example, pull up the 1H EUR/USD, and measure 40-45 bars from a major high or low.
You can quit and they won't care, but you will always know.