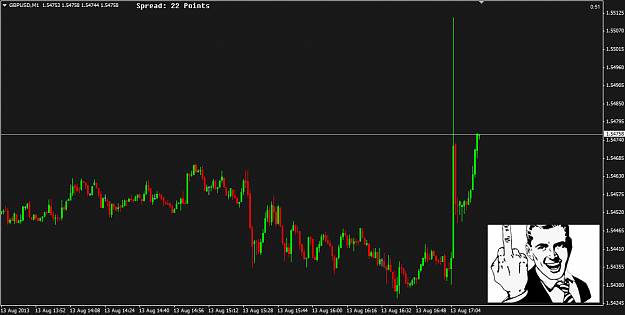
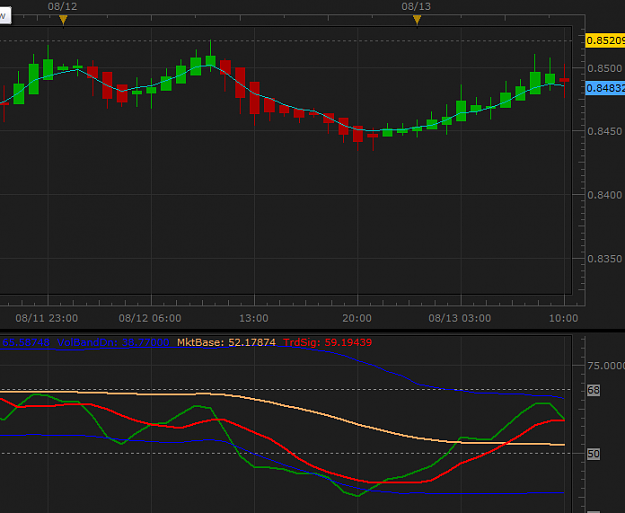
Hello everyone, I'm closely watching AUD/CHF for this upcoming candle. Rejected the nice round # .8500. It hasnt crossed yet on the 1 hr. however it has on the 30 min.
{quote} i am sorry i am not able to locate it. could you please help me...
Ignored
You need to figure this out for yourself because Phx62 has answered your question. If you can't figure out the indicator then you need to read the thread again or do a search because it is unfair to expect Phx62 to answer newbie questions millions of times over.
Guys this is a brilliant system... take the time to learn it and its indicators.
{quote} You need to figure this out for yourself because Phx62 has answered your question. If you can't figure out the indicator then you need to read the thread again or do a search because it is unfair to expect Phx62 to answer newbie questions millions of times over. Guys this is a brilliant system... take the time to learn it and its indicators.
Ignored
i am using the indicators which were given in post no. 25 on page 2. but still in the TDI indicator there is no option for market base line
first off, the reason I registered here was because of this thread and the people who are willing to help others to succeed. I started to learn forex in March this year, paused it in June to find out if its a short time love to forex or I love those numbers breathing on a chart. Now I'm back. I'm no longer learning forex, I'm trying to do my own study on forex and the TMS method. I'm reading the thread from scratch, besides I study on Babypips.
Okay that was my introduction to this forum but not the reason why I'm posting. I know it could be the wrong place to ask but I want to trade TMS on 4h chart. candle's should appear on 01:00, 05:00, 09:00, 13:00, 17:00, 21:00 (UTC/GMT +1, but cause of summertime +2 offset). Can anybody recommend a broker with those times?
Because I'm not that lazy as this question sounds I've tried some brokers before: Oanda, FXDD, FXCM, Alpari(UK), IBFX(AU/US) and I tried timeshift indicators but those were more pain then help to me.
Alright thats it. To the end I have to thank everybody who is helping, us ( beginner), to get a foot into forex. THANK YOU and keep helping!
{quote} today my other team sent me away because I ask them to do too much....and I have no place to hangout. LOL BTW, if you buy today, you may have to build up more position as price move lower.... just mark where this week' open is and drop down 160pips and there is where a reversal may happen... 160pips is where 60% of the average weekly traded range is . what if I am wrong? well, thank the person who invented Stop Loss in trading.
Ignored
Emmauel,
I meanwhile closed this position by hand, because there was a bearish TDI cross.
Can you please explain a bit more detailed why is it 60% of the weekly traded range that should be giving key levels? Perhaps I missed some posts... I checked the daily TF and there was a bearish TDI cross right on Monday... On my chart the red line in the middle is the open of the week, the upper red one is +160 pips and the lower one is -160 pips from the open.
I removed the HA candles, so on m chart there are normal Japanese candles. My signal candle which gave the bullish TDI cross was a bullish candle I could not identify it as BEOB.
- LO pullback candle
- rejection of EMA and structure resistance on LO
- TDI confirmation with bouncing from MBL
Entered on break of LO candle.
Usually i would exit on the close of the entering red candle because of the pullback.
I decided to stay in and it ended up in profit in the NY open candle.
What do u think about this setup and this trade manage? do u suggest to exit with a small loss (on the close of 2nd LS candle) and eventually re-enter on NY open after cleaning up the double bottom?
{quote} i am using the indicators which were given in post no. 25 on page 2. but still in the TDI indicator there is no option for market base line
Ignored
Hi Subharaj
Perhaps this TDI will help you. Use only Green, Red and Yellow lines. Rest of the lines just make them None. Also right click the indi and then click 'Modify'. You can find explanation of the indi. For your ready reference here it is;
//| Overall = Yellow line trends up and down generally between the |
//| lines 32 & 68. Watch for Yellow line to bounces off |
//| these lines for market reversal. Trade long when |
//| price is above the Yellow line, and trade short when |
//| price is below.
{quote} Change MBL color: Put your cursor on the Market Base Line in the TDI indicator that you have placed below your chart. Right click on it. "TDIVisualProperties" pops up. Left click on that. In the list that appears, #2 is "Yellow." Double-left click on that. Left-click the little black triangle to the right of box #2. Left click on the color you want. Then click OK. Let me know when you've received this and I'll delete my post.
{quote} Hi Subharaj Perhaps this TDI will help you. Use only Green, Red and Yellow lines. Rest of the lines just make them None. Also right click the indi and then click 'Modify'. You can find explanation of the indi. For your ready reference here it is; //| Overall = Yellow line trends up and down generally between the | //| lines 32 & 68. Watch for Yellow line to bounces off | //| these lines for market reversal. Trade long when | //| price is above the Yellow line, and trade short when | //| price is below. FxOptimu$ {file}
Ignored
Thk very much for the tdi alert
I would like to know the name of the indi that paint in the corner of the screen the direction of the market in that tf
like 1H Up 4H Down D Down all this wiht arrows
this threat if excellent the people Is so so helpfully and just follow the rules and read
again thk
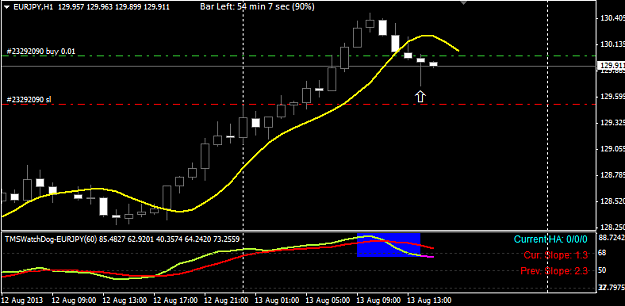
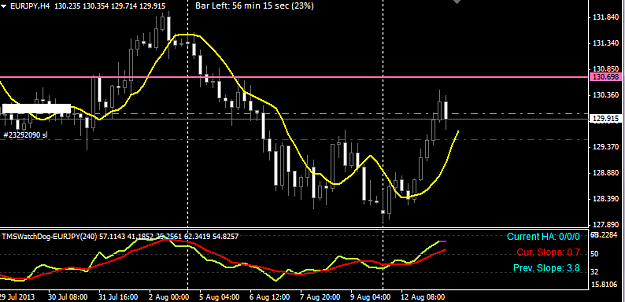
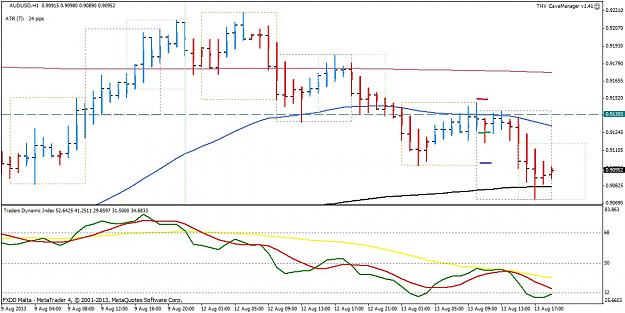
Hi Phx62, today i took the attached short trade based on: - LO pullback candle - rejection of EMA and structure resistance on LO - TDI confirmation with bouncing from MBL Entered on break of LO candle. Usually i would exit on the close of the entering red candle because of the pullback. I decided to stay in and it ended up in profit in the NY open candle. What do u think about this setup and this trade manage? do u suggest to exit with a small loss (on the close of 2nd LS candle) and eventually re-enter on NY open after cleaning up the double bottom?...
Ignored
Your entry was a little aggressive.....the actual TDI entry should have been at the open of the NY session....the candle just prior to the NYO was a good setup candle and the open of the NY candle would have been the classic TDI entry since the green crossed over the red and yellow at the open of that candle. Entry there would have been a little higher than the one you made......
All that being said, I would have probably entered on the candle you entered on....only a little closer to the open of that candle and I would have stayed in the trade like you did, with a SL where the red line is on your chart. The first or second candle of London usually sets the high or low of the session....in this case, the first candle did set the high. Consider the classic entry and the entry you made and decide which works for you and decide which one you are most comfortable with......Congratulations on a successful trade.
gsbharaj, I'd suggest you delete the TDI you are now using--it's colors have already been changed from the original. Apply the one that FX-optimus just posted. Then change the MBL color if you want to.
The thread originator passed away several months ago.
NY closing soon.
All over the world markets closed bullish....
AsiaPac traders ... wakey wakey time.
Sydney opening in 30mins and then Tokyo 3 hours later.
Honesty is a very expensive gift. You wont find it in cheap people.WBuffett
With regards to the TDI indicator, 255,255,255 represents "no color" ... double click on that field in #2 and a drop down menu should appear ... click on that and a menu of various colors should appear ... you might choose yellow or gold to closely duplicate the standard TDI color which is yellow and then you'll have the MBL which is simply a moving average showing trend ... same can be done with #1 and #3 but a visible blue color for the bollinger bands. Perform a Google search for "Trader's Dynamic Index" in order to learn more about it.
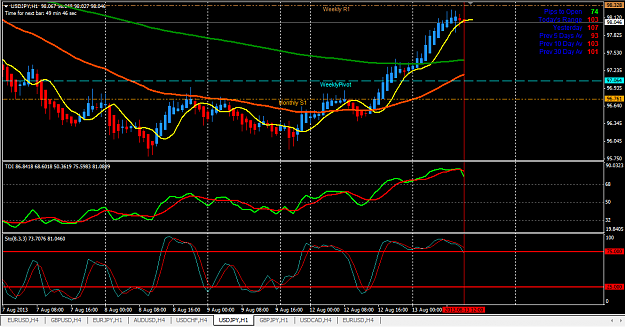
{quote} Armacom, Overall, weaker Yen so this trade is good. I long UJ and AJ but skip EJ ... no more money. Take a look at all JPY pairs to see the overall market sentiments .. regards, EMMANUEL
Ignored
Thank you for that Emmanuel ! Always read your comments with great interest ! And i am sure you will soon have enough funds with your À+++++++ traiding
Don’t ever let someone tell you that you can’t do something.