DislikedHi Please forgive me for asking a question before reading the entire thread first, if you have answered a similar question, and I have missed your answer, I apologise. I am not new to trading but am new to your system and find it very interesting. My question is regarding how you go about identifying and marking up your monthly, weekly and daily levels? In the pages I have read so far, you have described what you are looking for when price approaches these levels but I am still not totally clear on how you identify those levels in the first place....Ignored
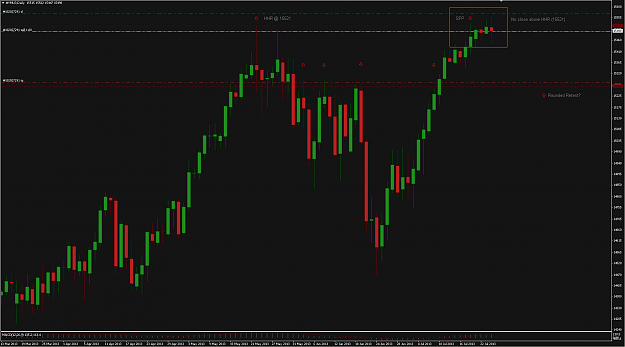
One is the HCR-LCS another is the SFP.
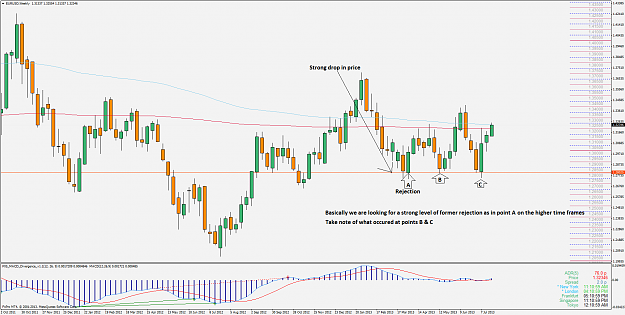
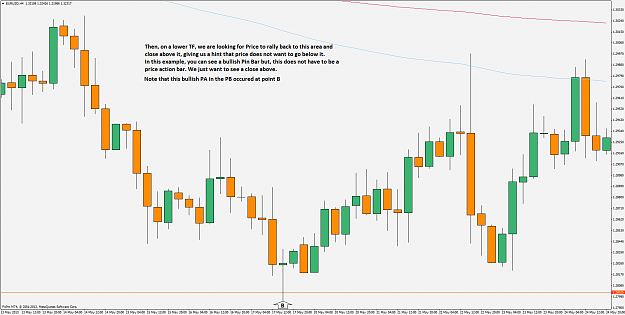
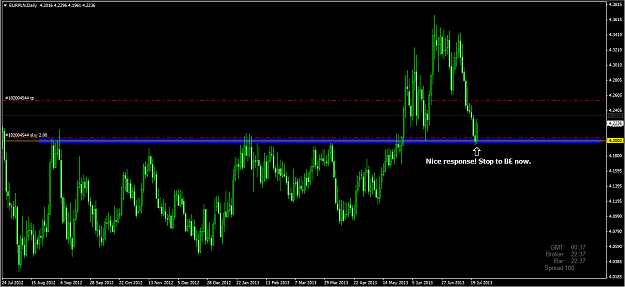
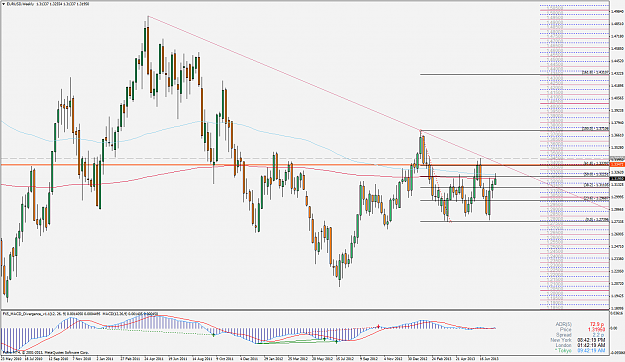
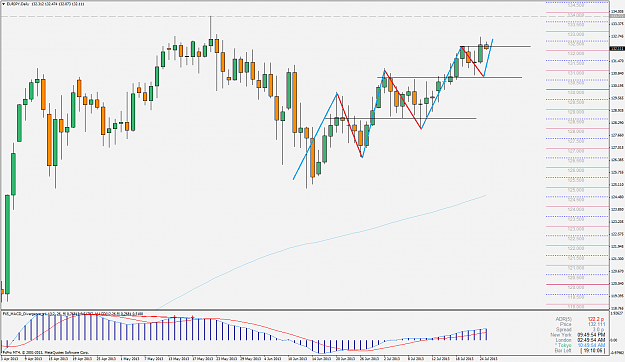
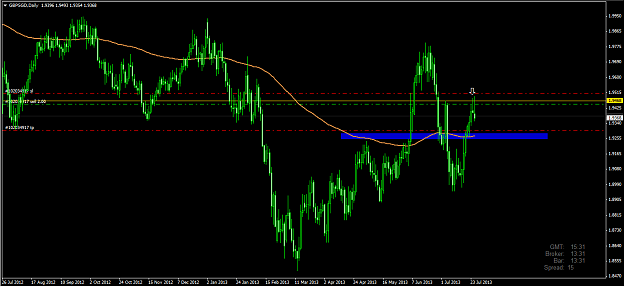
You identify these levels on the M W & D tfs by using the close of price, sometimes the close and open of the next candle are not the same, in which case you use both levels. The deeper & taller ones. I am just using the weekly level in this example but, it should give you the idea.
So, I am not sure which it is you are asking about.
Personally, I am trying to combine the two, so it may be rather complicated to explain what I am doing.
So I will explain the Lowest close of support in simple terms.
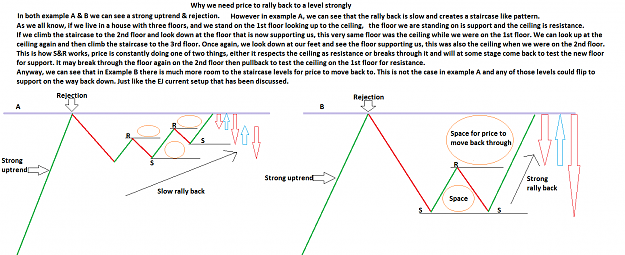
If you are talking about identifying the HCR & LCS levels, these diagrams will explain the basics of LCS.
The entries are what is complicated to explain because, we are using the levels in different ways.
Hope this helps with your question.
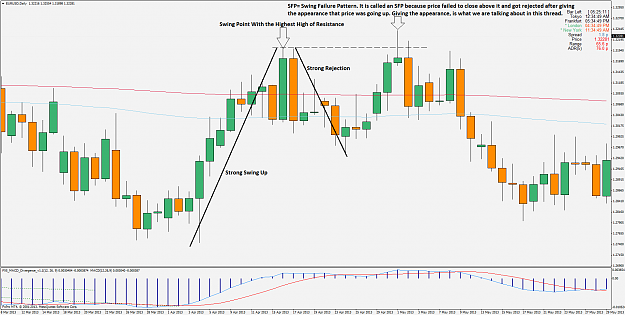
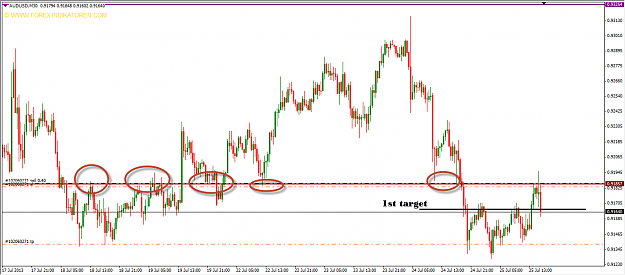
The SFP is more complicated but, as I do not know which you are asking about, I explained the regular S&R & PA that occurred at this level.
See the next post for a simple explanation of the SFP, which is the order flow and the main topic of this thread.
HCR & LCS along with Price Action is also the order flow but, as PA is a different manifestation of order flow by its nature, we will leave that for another day.
All these methodologies are basically using the order flow, just the entries are different.
Hope I am not confusing you further.
Attached Image(s) (click to enlarge)