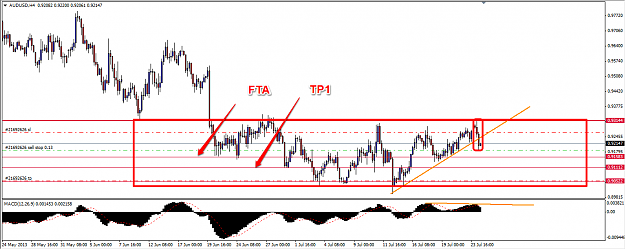
Dislikedsince the FX markets are pretty slow here is a homework chart I sent out to the PF Lets do it here too See if you can find the key components to watch as a technical trader. The pieces encompass a large range of concepts we use here But they also help one formulate potential trade plans(depending on style) Here is the blank chart what do you see? {image}Ignored
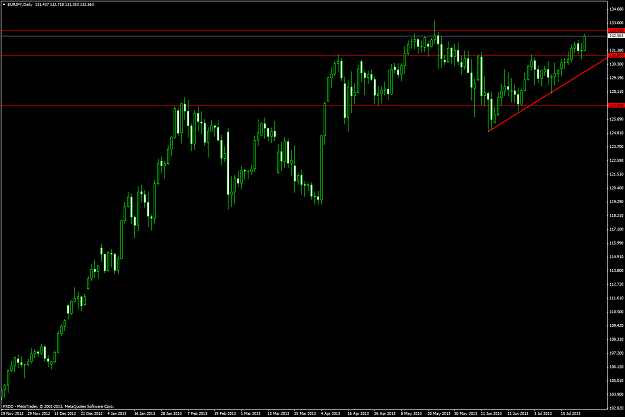
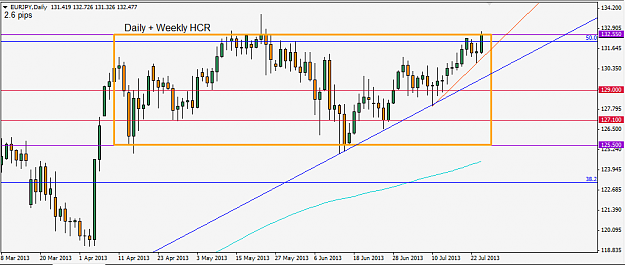
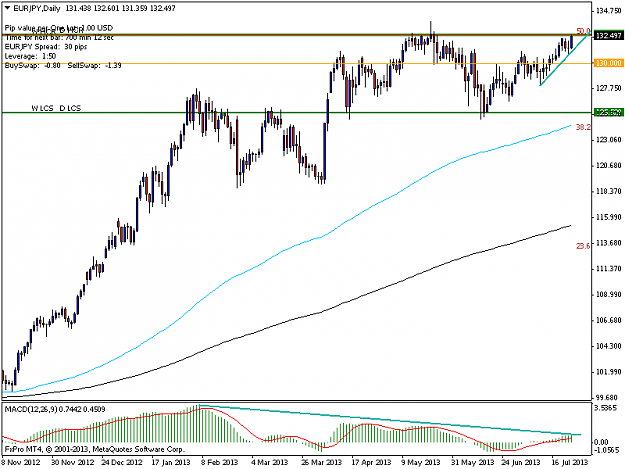
Price is ranging between 125.5 and 132.5. 132.5 seems to be an important area, as it is a W1 and D1 HCR as well as the 50% retracement of the last long term downward move (august 2008 - june 2012). Price is currently retesting these levels.
I personally would not put too much weight on the bearish MACD divergence, as EurJpy is the only JPY pair showing this.
Altogether:
- either there is a bearish PA by 132-133, ideally closing below the short-term ascending TL. SL above the setup, FTA by 130 (?)
- or I would play a PBTCA 132.61 (which is in line with playing the break of a 2-days BUOB it today closes above 132.61). SL below the ascending TL, FTA 133.7 ie previous bar High
eagerly waiting for your analysis
take care
Attached Image (click to enlarge)
Slow & steady