Disliked{quote} The similarity principle is simple and constant. However, there are many ways to apply it; you can use different indicators or setups. That is why there is a lot of different things going on here.Ignored
With all the fantastic work going on around Ralome's excellent indicator, I am a little hesitant about sharing my modest experiences but, in the light of Eurusdd's comment above about the use of the similarity principle with other indicators, I decided it may be useful to some. I am pretty good at logic processes but am seriously challenged spatially and so, although I understand what to look for with the stoch/BB and 1MA/BB, my brain finds it difficult to actually pick them out. I had some early success with the CI (thanks here to Madmoney) but I then discovered Eurusdd's other thread 'How to Use Technical Indicators'. Sadly this thread was de-railed early on by the all to common negative posters but the content for me was pure gold. In effect it is looking at similarity between the zigzag and stochastic. I actually use the ZZ Semafor and hopefully the image should show some examples clearly (I've never posted or attached anything before so hope this works!).
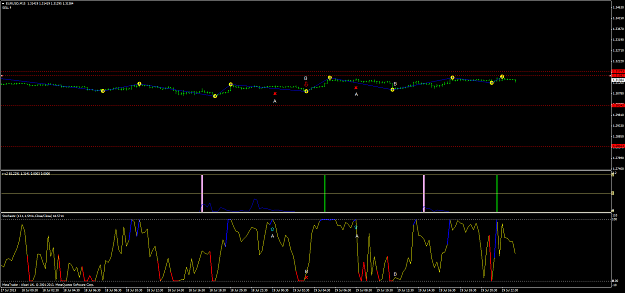
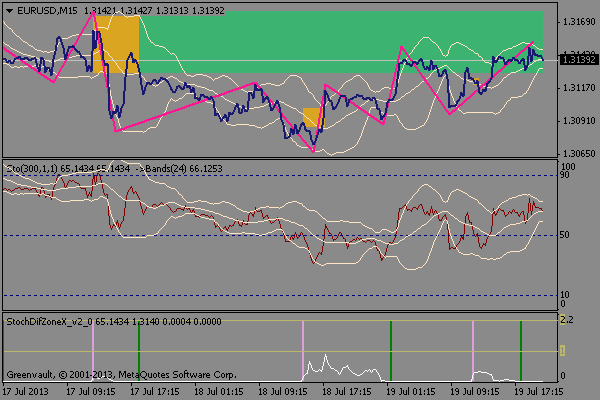
When the stochastic = 100, the semafor should be printing a new high (a yellow 3 on the chart) and, when the stochastic = zero, the semafor should be printing a new low. If the stochastic = 100 and a new high does not print, mark this price as it will be returned to. If a new high prints and the stochastic is < 100, in all probability the price will turn down as it is a fake top. So, in the chart, the first point A is a point of disimilarity because the stoch = 100 but no new high has printed. At the subsequent point B, a new low has been printed on the chart but the stoch has already moved up from zero so this would be a good point to enter in expectation of the price clearing the previous point A. In the following pair, the point A is again a point of disimilarity. B isn't actually disimilar but I would enter here, after a new low has printed and when the stoch moves away from zero in expectation that we are on a new zigzag up leg that will surpass the point A.
I hope this makes sense and that it reflects what Eurusdd was actually advocating. I was reassured by his insistence that price will go to 1.31583 as I have that level marked on my chart as one where a stochastic top was not matched by a new high on the chart. The other red dotted lines are prices that occurred on a pink bar in Ralome's indicator that have not subsequently been revisited (my brain can't cope with all the boxes but the information is invaluable).
I have used a value of 13 for the stoch and semafor on this 15m chart for demonstration purposes only, it is not a recommendation. I usually use a 5m chart and tend to use longer settings than this but am still experimenting with optimum settings. The important thing is that the settings for the stoch and semafor must be the same and the stoch should be set to close/close. I have been making money with this consistently but sometimes it takes a long time to return to the price so, if anyone can crack the question of which direction price will take off in after a similarity resumes, this would help considerably!
For those who are comfortable with the concept of similarity but are struggling a bit to spot it, play around with this and try different settings. It is truly a thing of beauty! Thank you again Eurusdd.
Attached Image (click to enlarge)