Buying Gold between 1250 and 1200 will be the wisest choice all the year
Ignored
The wisest choice.....to clear ur account
I don't understand why any investor in this world would buy gold:
1. there was no inflation with QE (we all know gold is used as a hedge against inflation) so u can imagine what it means without QE
2. the G bonds are offering higher yields all over the world including US bonds which are considered safe havens while gold has no yields to offer
3. from an industrial point of view the world seems to be in deep s**t and not even China produces anything any more so the demand for gold (as for the other industrial metals e.g copper) is falling
4. Europe gave a strong signal on how insignificant the gold is by asking Cyprus to sell his reserves to obtain the money they needed. Doing that once made it clear they will do it further.
Why the heck should someone buy the gold? This is a SELL the tops market. I see gold under 1000 by the end of the year.
Buy when everyone else is selling and sell when everyone else is buying !
{quote} Why the heck should someone buy the gold? This is a SELL the tops market. I see gold under 1000 by the end of the year.
Ignored
Did you sell Gold? I wonder if you would like to share your positions? in future too?
> so the demand for gold (as for the other industrial metals e.g copper) is falling
----> Request you to check the stats.
> Buying Gold between 1250 and 1200 will be the wisest choice all the year st Hidden Per Ignore List
> The wisest choice.....to clear ur account
----> I say opposite of this, I say begin buying in 12 hrs from now, if SL gets hit or not, buy around July-11 to July-15 again. I'll be here by the end of this year to support for what I say. I wish you be around too.
|
Joined Mar 2013
|
Status: SMART TRADES ONLY!
|675 Posts
Hey Clock Trader,
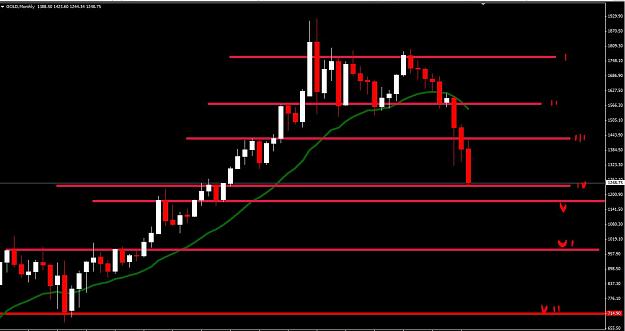
I have been following your thread since the first day and being a Technical Price Action trader,
I know for a fact that prices obey various RS and SUPP levels. I have marked these levels
over the past seven years that Gold has risen steeply before the dumping that caused this drop.
1430 and 1240 have been the recent levels and 1176 and 976 are the next barriers in the bearish move.
Attached Image (click to enlarge)
This is clearly marked in the chart above. Well I must confess that I don't consider the Indian festivity to be
a market move compared to China dumping its gold reserves, because the "Gold that matters" is not in the population but rather
in bank safes.
So looking at this chart and the sentiment that buying Gold at 1200 is the best decision keeping in mind that we have had any reversal signals
so far, What exactly justifies your claim?
Please explain in detail
I wrote this article on my blog on 20 of May 2013. As it is not a public blog I copy-paste it now specially for you "ClockTrader" on my other blog which is public and everyone can read it. If you still have doubts about my sincerity I invite you to leave me a private message (or just made it public, it's up to you) with your email address so I can add you to the list of people that can read my blog (the private one) so you can see the date of this article.
Until then you can read my article here: http://www.forex-galaxy.com/2013/06/...d-will-do.html
This is my view on gold. I have no crystal bowl so I might be wrong in the same percentage as I might be right but until now I am making money selling gold not buying it. Your suggestion to buy gold in 1200 - 1250 area is a good opportunity if you speculate a pull back but as I told you a few minutes ago I am a SELL the tops trader for this instrument.
Buy when everyone else is selling and sell when everyone else is buying !
Hey Clock Trader, I have been following your thread since the first day and being a Technical Price Action trader, I know for a fact that prices obey various RS and SUPP levels. I have marked these levels over the past seven years that Gold has risen steeply before the dumping that caused this drop. 1430 and 1240 have been the recent levels and 1176 and 976 are the next barriers in the bearish move. {image} This is clearly marked in the chart above. Well I must confess that I don't consider the Indian festivity to be a market move compared to China...
Ignored
Firstly, Thanks to both of you for being around & sharing your precious views. From a scientific point of view, if you go back in history & try buying in May-June-July & sell in January-February, try this every year, it will make tons of sense, trust me, you'll make money. This is apparently an investor's view. You can't buy once with SL 20 $s away & think its over. I can't share the Astro-lunar side as I have found no one here so far to share it with. If I say the details, it'll be like speaking alien language. As far as the bull course of Gold is concerned, I normally compare it like this: Gold price during:
.... my great-grandfather's marriage Vs my grandfather's marriage Vs my father's marriage Vs my marriage & looking forward to my kid's marriage in future & so on.. This chart is mind boggling. For going long like an investor, you need to have a long view of future. Even with very little money, one can make this happen.
I wrote this article on my blog on 20 of May 2013. As it is not a public blog I copy-paste it now specially for you "ClockTrader" on my other blog which is public and everyone can read it. If you still have doubts about my sincerity I invite you to leave me a private message (or just made it public, it's up to you) with your email address so I can add you to the list of people that can read my blog (the private one) so you can see the date of this article. Until then you can read my article here: http://www.forex-galaxy.com/2013/06/...d-will-do.html...
Ignored
OK, I'll pm you my email addy. I don't have any doubts about anyone's sincerity here. We are all traders / investors here to make money. Feel free to share your view, but, lets be sure our words are based on facts. In one year, both short loving & long loving guys may make tons of money here. Lets focus on making money buddy.
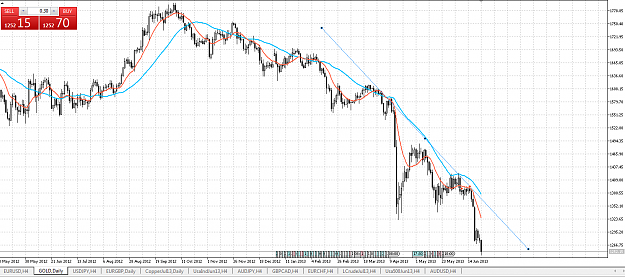
{quote} Target on the weekly chart @ 1258 area. The correction rally ended on May 13 with the completion of a small Head & Shoulder pattern on the daily chart. {image} Have a look at small Head & shoulder pattern and a valid rectangle on 4H chart. These formations were shared with traders on FF on 13th may when the gold was trading at 1472. {image}
Ignored
Target achieved, Next target may be 1226 then 1188 , where i 'll look for a setup , Bear weakness is necessary for me at these level otherwise no trade
{quote} Firstly, Thanks to both of you for being around & sharing your precious views. From a scientific point of view, if you go back in history & try buying in May-June-July & sell in January-February, try this every year, it will make tons of sense, trust me, you'll make money. This is apparently an investor's view. You can't buy once with SL 20 $s away & think its over. I can't share the Astro-lunar side as I have found no one here so far to share it with. If I say the details, it'll be like speaking alien language. As far as the bull course...
Ignored
Hey Clock Trader,
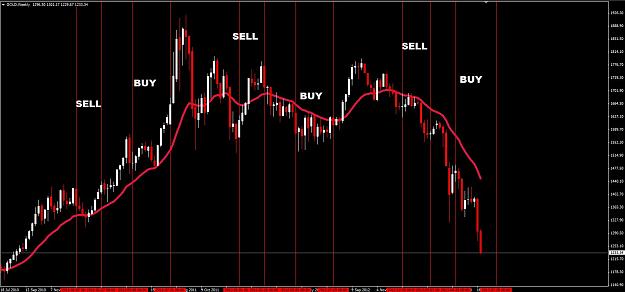
I must warn you at this point that I am a statistical programming student and at some point you will have to explain the lunar calender, and we will analyze it.
But just from a normal trader's standpoint, according to your buy sell model, ( buying in May-June-July & sell in January-February) here is the chart break down
Attached Image (click to enlarge)
Ideally Speaking this would work 2 out of 6 times in the past three years- which basically makes that statement invalid. So as much as you my have some theoretical statements, lets be more practical and since the history is available, place it in a charts and prove your theory
{quote} Hey Clock Trader, I must warn you at this point that I am a statistical programming student and at some point you will have to explain the lunar calender, and we will analyze it. But just from a normal trader's standpoint, according to your buy sell model, ( buying in May-June-July & sell in January-February) here is the chart break down {image} Ideally Speaking this would work 2 out of 6 times in the past three years- which basically makes that statement invalid. So as much as you my have some theoretical statements, lets be more practical...
Ignored
Give him a break Danny. He just expressed his opinion or his strategy. Everyone has one ! For example I am a fundamental trader so I trade only fundamentals. I only look at the charts to see entries and exits. That's it. This is my strategy.
I am sure you have one too.
You don't have to be so rough with him just because he thinks that his theory works. Maybe it will. Is not like he is trading your money or something.
Buy when everyone else is selling and sell when everyone else is buying !
{quote} Hey Clock Trader, I must warn you at this point that I am a statistical programming student and at some point you will have to explain the lunar calender, and we will analyze it. But just from a normal trader's standpoint, according to your buy sell model, ( buying in May-June-July & sell in January-February) here is the chart break down {image} Ideally Speaking this would work 2 out of 6 times in the past three years- which basically makes that statement invalid. So as much as you my have some theoretical statements, lets be more practical...
Ignored
young man, statistics sucks. Cause/effect logic sucks. Look how draconian 'modern' medicine has become based on these outdated ideas.
Ancient science based on stars, moon etc was supressed at some point in history but you cant supress the truth. It really works.
{quote} young man, statistics sucks. Cause/effect logic sucks. Look how draconian 'modern' medicine has become based on these outdated ideas. Ancient science based on stars, moon etc was supressed at some point in history but you cant supress the truth. It really works. Ask your girlfriend what drives her moods ....
Ignored
Yeah whatever!
Statistics does suck, if you don't like math as is the case to many people. However what you call the truth is not necessarily factual.
The chart I posted is based on facts, isn't it?
My girlfriend has never made a buck in the market. but I have and I trade the facts only.
So lets follow what's factual..........
Danny
{quote} Hey Clock Trader, I must warn you at this point that I am a statistical programming student and at some point you will have to explain the lunar calender, and we will analyze it. But just from a normal trader's standpoint, according to your buy sell model, ( buying in May-June-July & sell in January-February) here is the chart break down {image} Ideally Speaking this would work 2 out of 6 times in the past three years- which basically makes that statement invalid. So as much as you my have some theoretical statements, lets be more practical...
Ignored
I'm not sure what you are doing. I'm creating positions on weekly & monthly chart now to show it to you guys. Please allow me a few hrs. You have to buy in May-June-July, take average of these three months. Secondly, I will share with you the Astro-Lunar Charts, if you can understand even 10% of it, I will explain the remainder 90%. If you are indeed keen, you'll need to learn Vedic Astrology. We are not supposed to talk/discuss astrology after noon hrs, but, only in the morning. Allow me until tomorrow to share Astro chart.
For the seasonal buying, I am working on 10 years. It should work great even on 2-3 yrs. May-June-July is technically summers when you buy & sell in peak winters in Jan-Feb.
{quote} Give him a break Danny. He just expressed his opinion or his strategy. Everyone has one ! For example I am a fundamental trader so I trade only fundamentals. I only look at the charts to see entries and exits. That's it. This is my strategy. I am sure you have one too. You don't have to be so rough with him just because he thinks that his theory works. Maybe it will. Is not like he is trading your money or something.
Ignored
Why do I need a break buddy? I've been in InfoTech industry for almost 20 yrs now, I know how science works. I loves science like I love ancient technicals. If I can't prove my point, at least on broad level, I would consider my ideas worthless. I'm here to make money on the basis of ancient Indian technicals. The fact is that I know how Forex (Gold) works, its only a matter of time as I'm still in the learning stage.
{quote} Yeah whatever! Statistics does suck, if you don't like math as is the case to many people. However what you call the truth is not necessarily factual. The chart I posted is based on facts, isn't it? My girlfriend has never made a buck in the market. but I have and I trade the facts only. So lets follow what's factual.......... Danny
Ignored
My mate, 100% scientific facts are on way to support my seasonal theory, just stay around. The formula is simple, buy in May-June-July (average it out), sell in Jan-Feb (~8 months) later.
{quote} Give him a break Danny. He just expressed his opinion or his strategy. Everyone has one ! For example I am a fundamental trader so I trade only fundamentals. I only look at the charts to see entries and exits. That's it. This is my strategy. I am sure you have one too. You don't have to be so rough with him just because he thinks that his theory works. Maybe it will. Is not like he is trading your money or something.
Ignored
this is exactly majority trader mindset. One has to adopt style to extract from that large pool.
{quote} Hey Clock Trader, I must warn you at this point that I am a statistical programming student and at some point you will have to explain the lunar calender, and we will analyze it. But just from a normal trader's standpoint, according to your buy sell model, ( buying in May-June-July & sell in January-February) here is the chart break down {image} Ideally Speaking this would work 2 out of 6 times in the past three years- which basically makes that statement invalid. So as much as you my have some theoretical statements, lets be more practical...
Ignored
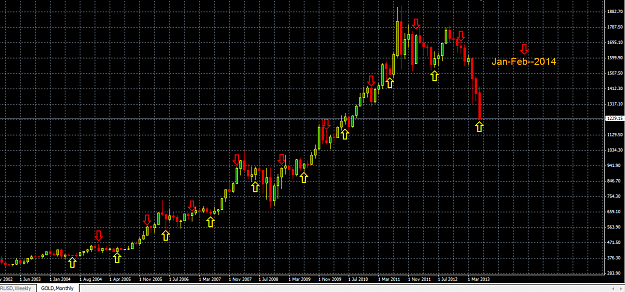
Dear Johny,
If you post a misleading chart here again, that would be considered VERY BAD. Actually I want you to promise the people here that you won't do such a thing again here.
Ask even a noob trader what this chart has to say? You would buy on yellow arrow up, which is about June of the year & you would sell 8 months later. Only one year fails which was 2008, if you were in this business, you would remember how crude fell down to below $40 & so did all markets.
Even in 2008, if one could buy Gold downward on every 10% down, he would have made plenty by the selling season.
For me, I will SELL gold whenever there is a small bounce. There are several fundamental reason.
1. The Paper gold is selling. There is a huge outflow of hot money from ETFs to Bonds and other safer investments.
2. Interest rates will rise if Fed holds to its promise. rising interest adversely affects gold price
And on the Physical side
1. India (Biggest Physical Buyer) - Indian government recently put several measures to curb import of bullion to reduce its current account deficit. Major steps include rising import duties and restriction on banks to lend based on gold assets. Also the general public mood is also shifted. As an Indian, i know that the buying in India is slowing. Earlier people used to run to gold shops whenever there was a dip. But with continued dips, buyers are waiting to see whether it goes down further.
2. China (Second Biggest Buyer) - There is a huge credit crunch in China as of now. The government is trying to control the rampant bad dept problems there. So it will take a few more years before banks to clear up their books from bad loans. Expect a short term credit squeeze there.
From the above points, I believe gold is a Sell now. 1250 was a major support and that is also broken today. If it manages to close below that, then 1200 will be the next target. If the Fed doesnt show signs of further squeezing, we can see gold near 1040 by year end.