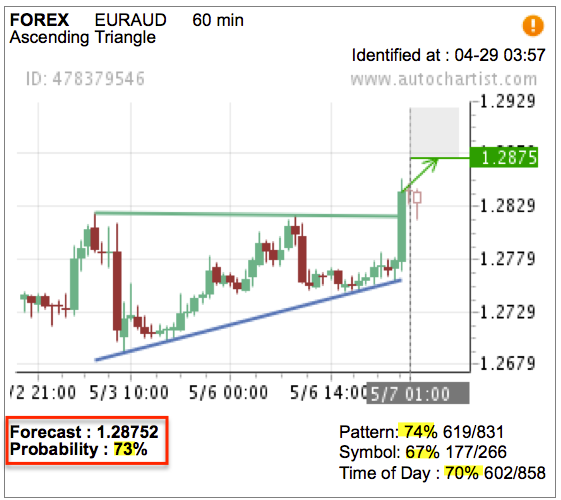
"Our Favourites" FREE trade for today . #EURAUD with a 73% probability based on our performance stats. #forex #daytrading #breakout @autochartist
Sign up for FREE www.autochartist.com
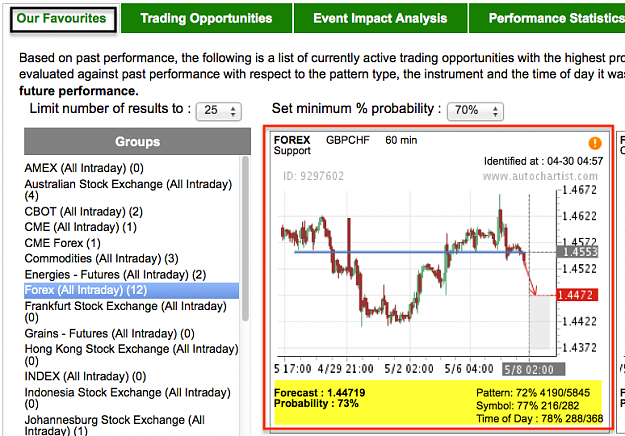
I recently subscribed to Autochartist’s latest e-mail feature and received this trade opportunity alert this morning. Autochartist’s latest feature provides traders with a quick morning technical outlook of the markets.
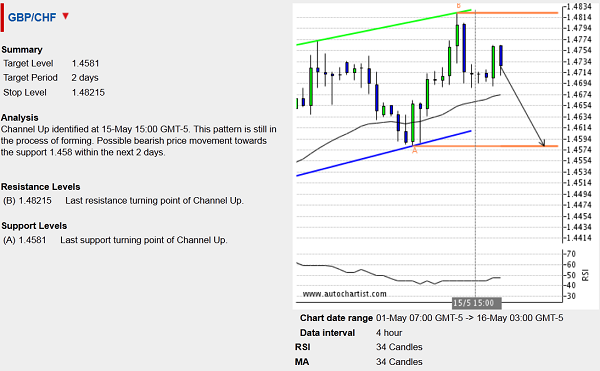
Autochartist recently identified the 4-hour Up Channel chart pattern on the GBP/CHF charts – as you can see from the this trade opportunity alert that I received today for this currency pair. GBP/CHF is expected to fall to the target level 1.4581 in 2 days. The stop-level for this forecast is set at 1.4821 (B, the top of this chart pattern). This level was formed earlier when GBP/CHF reversed sharply down from the strong resistance zone consisting of the weekly resistance trendline from the middle of 2010, the 50% Fibonacci Correction of the preceding downward price impulse from 2012 as well as the pivotal resistance 1.4800.
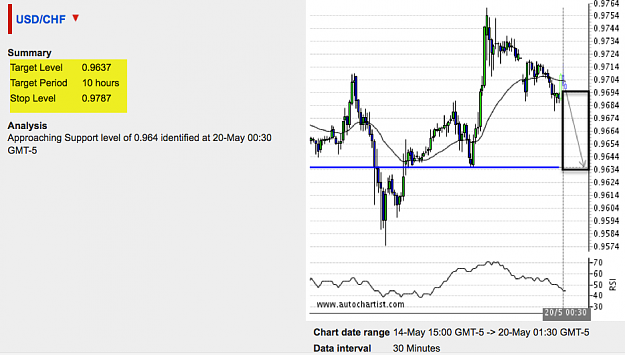
According to this trading idea USD/CHF is approaching the support level of 0.964 The Stop Level is suggested to be at 0.9787 and the target period is 10 hours. This chart shown here is a 30 minute candle chart interval.
Attached Image (click to enlarge)
This trade is also backed up by a 34 Moving average which is pointing downwards as well as a RSI below the 50 level.
Autochartist’s latest feature provides traders with a quick morning technical outlook of the markets.
EUR/USD continues to fall in accordance with the following trade opportunity alert that I received today for this currency pair. The pair is set to reach the target level 1.2837 in the next 13 hours. This target level is in itself the Key Support Level (of the type Approach) which has been recently identified by Autochartist on the hourly EUR/USD charts. The pair recently corrected up from the support area close to the strong support level 1.2750 (which previously reversed the pair sharply up at the start of April). The upward correction quickly lost its momentum – given the prevailing medium-term downtrend which is affecting the pair now. Look for the pair to fall to the target level 1.2837 in the next 13 hours.
As you can see from the following Volatility Analysis chart for EUR/USD, the lower boundary of the daily Expected Price Range calculated by Autochartist for this pair (1.2831) nearly coincides with the target level given in the above trade alert (1.2837) – which heightens the probability that the Euro will soon reach this target.
To subscribe to the e-mail alerts feature is quick and easy. Log into the Autochartist platform, click on ‘Alerts & Messaging’, enter your email address, select the market you want covered, select your language, and the time you want to get your report, and you’re done! You will now receive a quick morning technical outlook of the markets.
CAD/JPY continues to fall inside the Flag chart pattern identified by Autochartist on the daily charts, as you can see from the following trade opportunity alert that I received today for this currency pair. The pair is expected to fall further toward the target level 96.27 in the following 7 trading days. The stop-level for this bearish forecast is set by Autochartist at 100.975 (point B, which is the top of this Flag). This level formed when the pair reversed down from the resistance level 101.00. The pair is set to fall further toward the target level 96.27, which is also indicated by the Volatility Analysis shown below.
As you can see from the following Volatility Analysis chart for CAD/JPY, all of the daily Expected Price Range (EPR) calculated by Autochartist for this pair (from 100.2143 to 98.3627) stands below the aforementioned resistance level 101.00, while the lower boundary of the EPR (98.3627) is located below the projected value of the lower support trendline of this Flag – which suggests that it might soon be broken, which should accelerate the downward movement toward the target level 96.27 in the next 7 trading days.
To subscribe to the e-mail alerts feature is quick and easy. Log into the Autochartist platform, click on ‘Alerts & Messaging’, enter your email address, select the market you want covered, select your language, and the time you want to get your report, and you’re done! You will now receive a quick morning technical outlook of the markets.
For further information on this and other Autochartist products visit www.autochartist.com
I recently subscribed to Autochartist’s latest e-mail feature and received this trade opportunity alert this morning. Autochartist’s latest feature provides traders with a quick morning technical outlook of the markets.
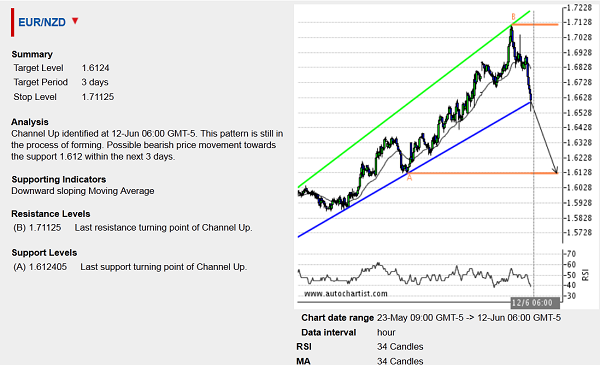
EUR/NZD continues to fall after the recent reversal from the upper resistance trendline of the daily Up Channel chart pattern identified by Autochartist, as you can see from the following trade opportunity alert that I received recently for this currency pair. EUR/NZD is expected to fall to the target level 1.5252 in the next 7 trading days. Autochartist set the stop-loss at the close price level 1.6043 (point B, the top of this Up Channel). Point B formed recently when the pair reversed down from the resistance area lying at intersection of the round resistance level 1.6000 and two longer-term resistance trendlines – one is the resistance trendline of the weekly Triangle from May of 2012, the other is the former upward support trendline from August of the same year (as you can see from the second chart below).
To subscribe to the e-mail alerts feature is quick and easy. Log into the Autochartist platform, click on ‘Alerts & Messaging’, enter your email address, select the market you want covered, select your language, and the time you want to get your report, and you’re done! You will now receive a quick morning technical outlook of the markets.
For further information on this and other Autochartist products visit www.autochartist.com
http://www.autochartist.com/daily-fo...date-chfjpy-9/
By: Dima Chernovolov I recently subscribed to Autochartist’s latest e-mail feature and received this trade opportunity alert this morning. Autochartist’s latest feature provides traders with a quick morning technical outlook of the markets.
CHF/JPY continues to rise in accordance with the following trade opportunity alert that I received today for this currency pair. The pair is expected to rise to the target level 106.64 in 3 trading days (point B, the last connecting point of the Triangle chart pattern identified by Autochartist on the daily CHF/JPY charts). Autochartist sets the stop-level for this forecast at the opposite side of this chart pattern, at 104.035 (point A). This Triangle continues the predominant uptrend visible on the daily and the weekly CHF/JPY charts. Given the strength of the uptrend affecting the pair there is a high probability the pair will rise to the target level 106.64 in 3 trading days.
As you can see from the following Volatility Analysis chart for CHF/JPY, the upper border of the daily Expected Price Range calculated by Autochartist for this currency pair (106.25) stands close to the target level given in the above trade opportunity alert (106.64), which adds to the likelihood the pair will continue to rise toward 106.64 tomorrow.
To subscribe to the e-mail alerts feature is quick and easy. Log into the Autochartist platform, click on ‘Alerts & Messaging’, enter your email address, select the market you want covered, select your language, and the time you want to get your report, and you’re done! You will now receive a quick morning technical outlook of the markets.
For further information on this and other Autochartist products visit www.autochartist.com
I recently subscribed to Autochartist’s latest e-mail feature and received this trade opportunity alert this morning. Autochartist’s latest feature provides traders with a quick morning technical outlook of the markets.
As you can see from the following trade opportunity alert, EUR/CHF has recently broken down through the Key Support Level 1.242 identified by Autochartist on the 30-minute charts. The pair is expected to fall to the target level 1.2355 in the next 2 trading days. Autochartist sets the stop-level for this bearish forecast at 1.2517. This downward breakout follows the recent downward price impulse from the strong resistance level 1.2570 (point A), which had previously reversed the pair sharply down in January of 2013 (as you can see on the third chart below). The Volatility Analysis shown below confirms this forecast.
As you can see from the following Volatility Analysis chart, the lower border of the daily Expected Price Range calculated by Autochartist for this currency pair (1.2353) nearly coincides with the target level calculated for the above Key Level breakout (1.2355) – which heightens the probability the pair will soon reach 1.2355.
To subscribe to the e-mail alerts feature is quick and easy. Log into the Autochartist platform, click on ‘Alerts & Messaging’, enter your email address, select the market you want covered, select your language, and the time you want to get your report, and you’re done! You will now receive a quick morning technical outlook of the markets.
For further information on this and other Autochartist products visit www.autochartist.com
I recently subscribed to Autochartist’s latest e-mail feature and received this trade opportunity alert this morning. Autochartist’s latest feature provides traders with a quick morning technical outlook of the markets.
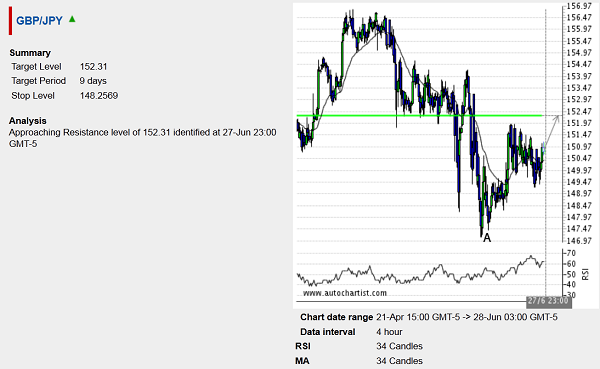
GBP/JPY continues to fall in accordance with the following trade opportunity alert that I received today for this currency pair. GBP/JPY is expected to fall toward the Key Support level 151.388 (of the type Approach) in the next 7 trading days. The pair earlier reversed sharply down (at point A) from the strong combined resistance area lying at the intersection of the following resistance levels: the upper weekly Bollinger Band, the resistance trendline of the weekly Up Channel from November of 2012 as well as the resistance level 157.00 (all backed up by the strong bearish divergence visible on the weekly Momentum indicator). The sharp downward reversal from this resistance area created the weekly Japanese Candlestick reversal pattern – Evening Doji Star – which increases the probability the pair will fall to the target level 151.388 in 7 days.
To subscribe to the e-mail alerts feature is quick and easy. Log into the Autochartist platform, click on ‘Alerts & Messaging’, enter your email address, select the market you want covered, select your language, and the time you want to get your report, and you’re done! You will now receive a quick morning technical outlook of the markets.
For further information on this and other Autochartist products visit www.autochartist.com
I recently subscribed to Autochartist’s latest e-mail feature and received this trade opportunity alert this morning. Autochartist’s latest feature provides traders with a quick morning technical outlook of the markets.
As you can see from the following trade opportunity alert for EUR/NZD, this currency pair is expected to fall to the target level 1.6124 in the next 3 trading days – after recently penetrating the lower support trendline of the hourly Up Channel identified by Autochartist. Autochartist set the stop-level for this forecast at 1.7112 (point B, the top of this Up Channel). This point formed earlier, when EUR/NZD failed to break up above the resistance zone lying between the round resistance level 1.7000 (which had previously reversed the pair sharply down in May of 2012) as well as the 50% Fibonacci Retracement of the preceding weekly downward price impulse from March of 2011 (as you can see on the second chart below).
To subscribe to the e-mail alerts feature is quick and easy. Log into the Autochartist platform, click on ‘Alerts & Messaging’, enter your email address, select the market you want covered, select your language, and the time you want to get your report, and you’re done! You will now receive a quick morning technical outlook of the markets.
By: Dima Chernovolov I recently subscribed to Autochartist’s latest e-mail feature and received this trade opportunity alert this morning. Autochartist’s latest feature provides traders with a quick morning technical outlook of the markets.
EUR/CAD recently broke the Key resistance level 1.3540 identified by Autochartist on the daily charts. The pair is expected to continue upward movement toward the target level 1.3792 in the next 23 hours. The breakout of this Key Level continues the strong medium-term uptrend from August of 2012 visible on the daily EUR/CAD charts. The pair recently corrected up from this Key Level and is set to rise further toward 1.3792 in the nearest time – which can also be seen from the Volatility Analysis shown below.
As you can see from the Volatility Analysis chart for EUR/CAD below, the lower border of the daily Expected Price Range calculated by Autochartist for this pair (1.3546) stands above the aforementioned broken key resistance level 1.3540, which heightens the probability that the pair will continue to rise above this level tomorrow.
To subscribe to the e-mail alerts feature is quick and easy. Log into the Autochartist platform, click on ‘Alerts & Messaging’, enter your email address, select the market you want covered, select your language, and the time you want to get your report, and you’re done! You will now receive a quick morning technical outlook of the markets.