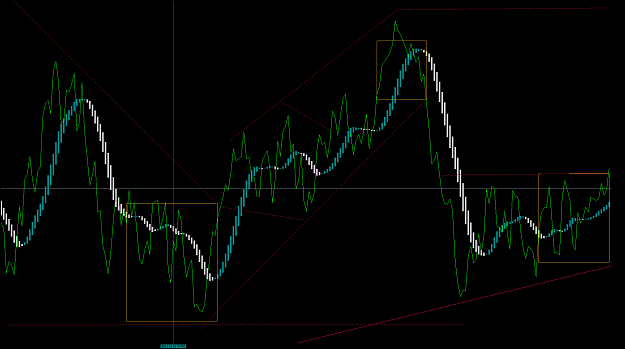
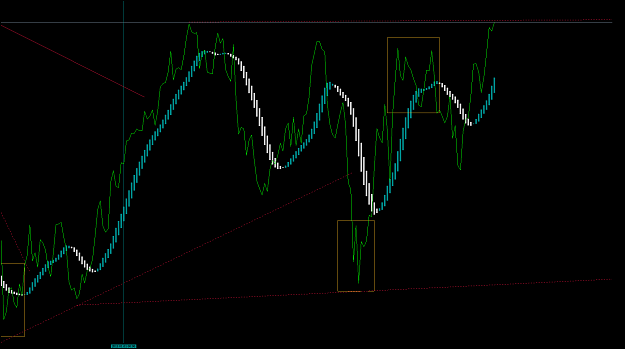
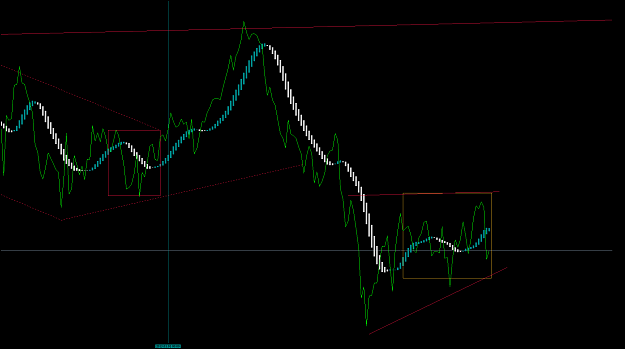
Here are some trade set-ups that might tinker your bells. These are hard right edge charts, so you could take them right now if you wish.
The interesting part is how long would you hold them and where might you exit?
The charts consist of trend lines, heiken aishi indicator and price as a green line. Possible or actual trades taken are yellow boxes, with red boxes as likely failures. Nearly naked you might say.
Pretty simple to follow, right?
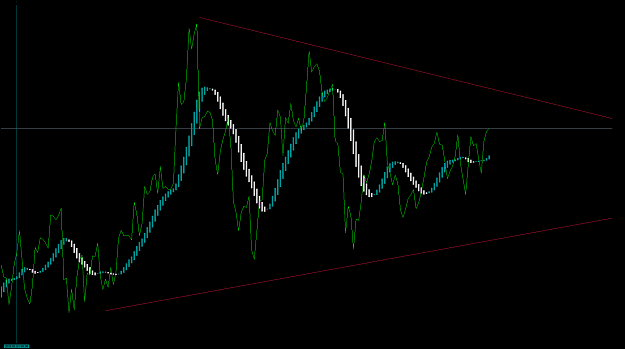
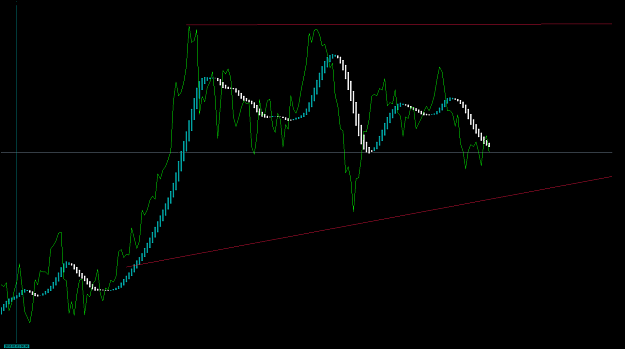
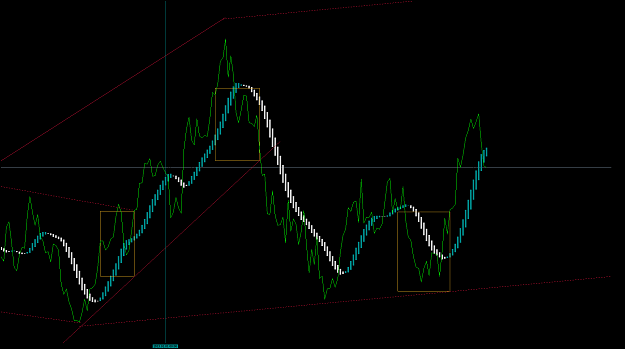
Here is a current set up on Brent Crude. Could, or would, you take it? [Daily and Weekly charts]
The interesting part is how long would you hold them and where might you exit?
The charts consist of trend lines, heiken aishi indicator and price as a green line. Possible or actual trades taken are yellow boxes, with red boxes as likely failures. Nearly naked you might say.
Pretty simple to follow, right?
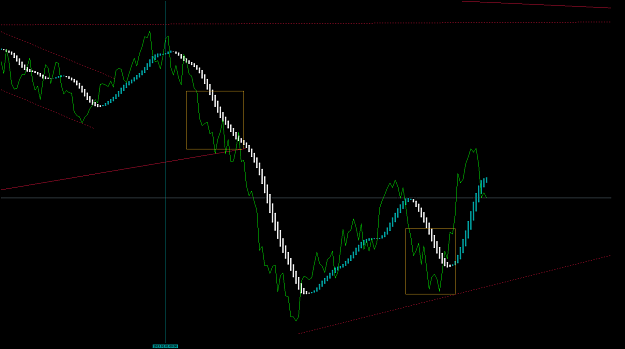
Here is a current set up on Brent Crude. Could, or would, you take it? [Daily and Weekly charts]