{quote} you have the real price candlestick in the foreground on top of the APB on your chart setup, so what is confusing you? your chart looks clear and you see the actual price candlesticks..
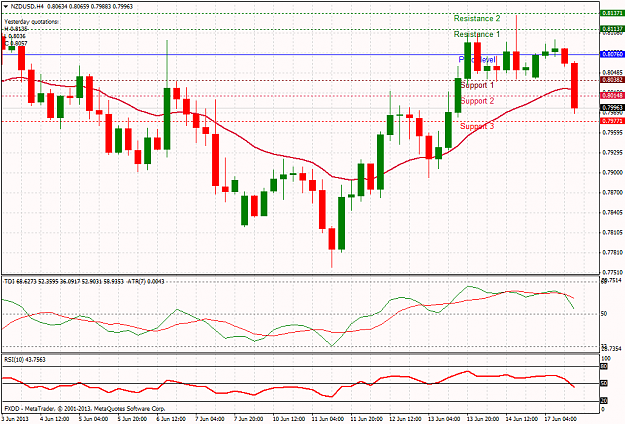
I entered this trade, 2 micros, @8am on the 4H. Two TPs, one @.8039 & second @.8013 - both hit while out running errands and added a little over 2% to my demo balance. I like FXDD's times better than Oanda's, my live acct and just may have to switch over. Still demoing for now.
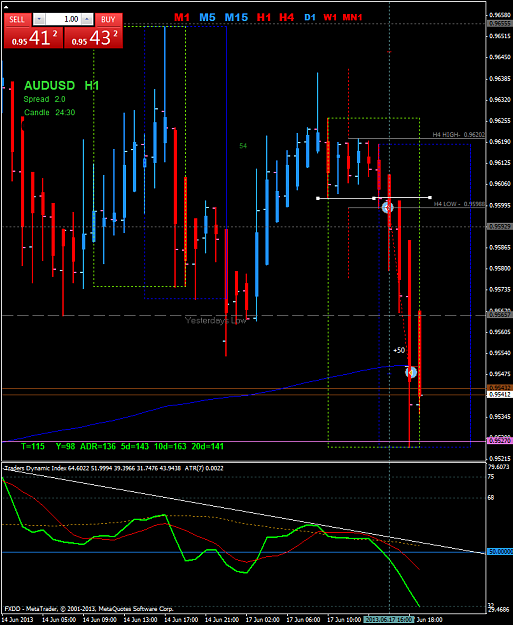
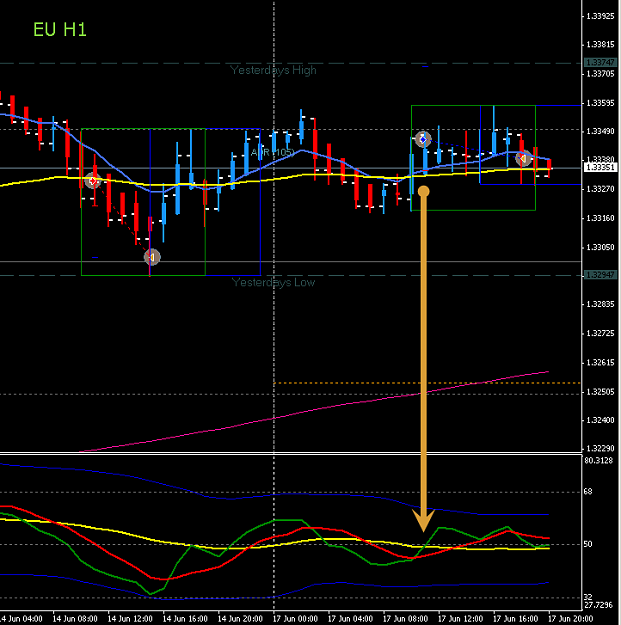
Took a couple of EJ trades following the market open because of the big ADR's from last week. Both trades entered with a 40TP & 40SL because it was the Asian session.
Also took one AU trade that just completed...based on the break below the session low at the time and the TDI green crossing the 50 line and TDI red crossing the yellow in a TDI downtrend. I did not take this trade at LO following the pullback candle because there was no separation of the TDI lines and the other pairs I watch seemed to be ranging.
|
Joined Feb 2012
|
Status: Seeing the light
|526 Posts
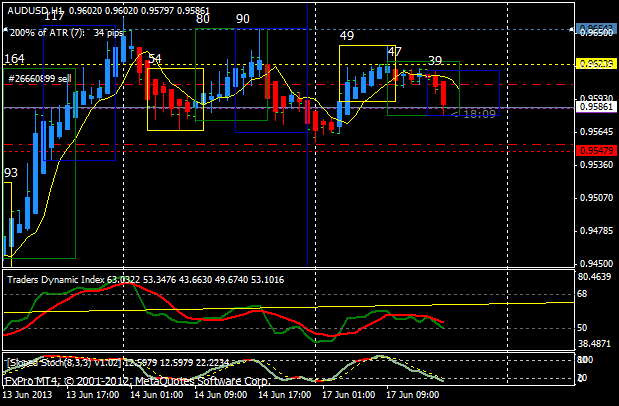
2 trades for today
AU for +50 pips
and EU for BE
whew what a long time before they move. Honestly the last few hours on both trades, i have given up on them, so i change my SL and placed them at BE and went back to bed, this morning woke up to a BE and +50. I'll take the +50 thank you.
AU trade:
My 1st SL on AU trade was at the top of the yellow box (Asia session high). After it moved for 20 pips, i decided to BE the trade. TP was right on the low of the market which is really close to the Support at 0.9548. In hindsight i should have remembered price loves to test support and resistance, and every time they does it, they will go over support or resistance by a few pips at least. For me the right TP should have been right on the Support..but oh well...
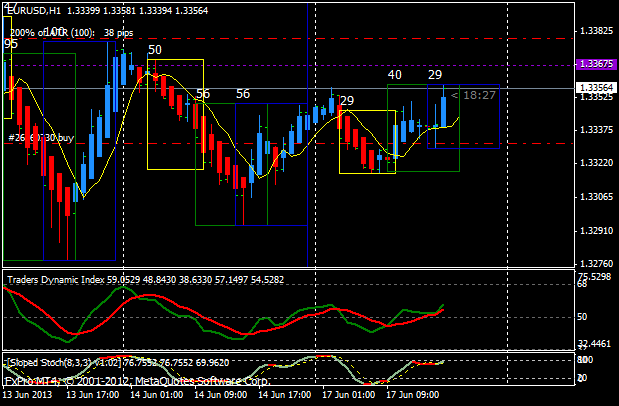
EU trade:
Honestly, this does not turn up like what i think it should be. The entry was confirmed 1st by PA which show bullish engulfing. TDI crossed after the hour of that bullish engulfing. My first SL was 4 pips under the low of Asia session. After priced moved 20 pips, i decided to BE my trade. And then i go to sleep, my expectation was for it to move at least 50 pips or to Friday's high. Well....doesn't happen. In hindsight, i should have realized there wasn't much of a bull drive due to all those wick on bull candles..
{quote} Hey Emmanuel, seems everybody is pulling your jacket! I'm pulling too! :-) I read the pdf twice, the Best of Big E, and I made my plan. I'm gonna trade this for a couple of weeks, just the majors on the H4 and daily, but not with all the indicators mentiioned here. I'll use the set-up of Big E for now, just the stochastics and TDI with the HA candles (Synergy APB), the EMA200/100 and my own common sense. Now you promised me step 2! :nerd: Sorry, forgot the magic word: Pleeaase!!??!
Ignored
Backtest EU 300 trades ;p. Time to build up confidence and familiarize yourself with the TDI cross. Also start drawing S&R lines on your chart and see how they react with price.
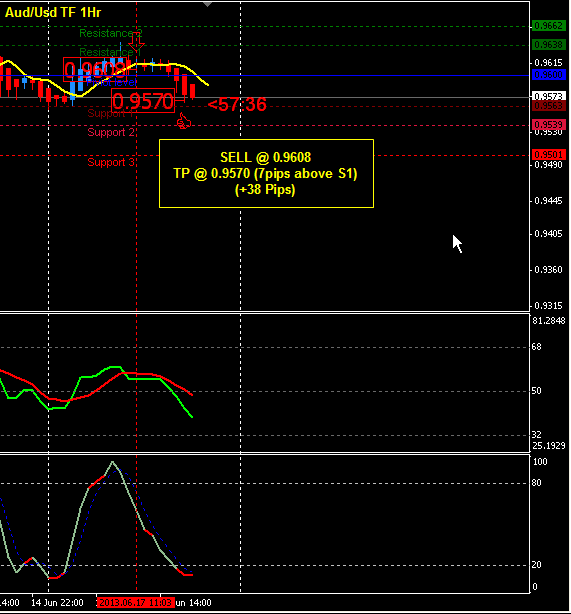
Took a couple of EJ trades following the market open because of the big ADR's from last week. Both trades entered with a 40TP & 40SL because it was the Asian session. Also took one AU trade that just completed...based on the break below the session low at the time and the TDI green crossing the 50 line and TDI red crossing the yellow in a TDI downtrend. I did not take this trade at LO following the pullback candle because there was no separation of the TDI lines and the other pairs I watch seemed to be ranging. {image}{image}
Ignored
Hello phx62. Inspiring as usual. Asides from the volatility last week, what other criteria did you look at for the Europe joy trades? I can't identify the price action. Does it have anything to do with breakout?
Thanks
Took a couple of EJ trades following the market open because of the big ADR's from last week. Both trades entered with a 40TP & 40SL because it was the Asian session. Also took one AU trade that just completed...based on the break below the session low at the time and the TDI green crossing the 50 line and TDI red crossing the yellow in a TDI downtrend. I did not take this trade at LO following the pullback candle because there was no separation of the TDI lines and the other pairs I watch seemed to be ranging.
Ignored
Hello Phx62, thanks for your analysis.
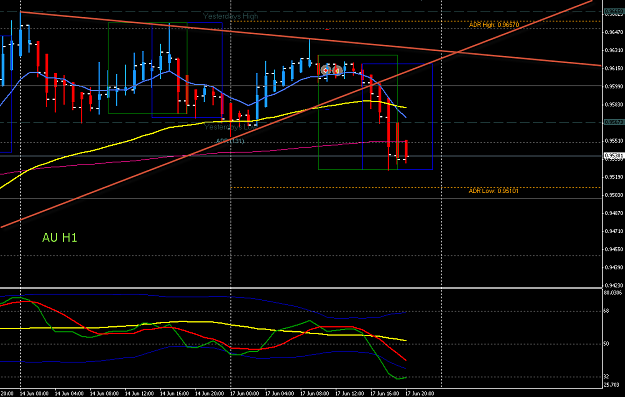
AU: BE
Entry after pullback and TDI cross.
Exit after ranging and after I realized two factors: RN below my entry, price squeezing inside trend line.
EU: -7 pips
Entry after TDI cross (red, yellow and 50). Good H4/D1 TDI and chart. Good ADR from my indy, but no momentum and ranging.
{quote} Hello phx62. Inspiring as usual. Asides from the volatility last week, what other criteria did you look at for the Europe joy trades? I can't identify the price action. Does it have anything to do with breakout? Thanks
Ignored
When the ADR has been up during the previous week on JPY or AU pairs and there is little pending news, I have found that many times price will trend following market open after the weekend. Nothing more than that.
{quote} Hello Phx62, thanks for your analysis. AU: BE Entry after pullback and TDI cross. Exit after ranging and after I realized two factors: RN below my entry, price squeezing inside trend line. EU: -7 pips Entry after TDI cross (red, yellow and 50). Good H4/D1 TDI and chart. Good ADR from my indy, but no momentum and ranging. Have you some considerations for me? Thanks! {image} {image}
Ignored
You described it....no momentum and ranging markets.......probably won't see much price movement until the G8 meetings and the US Federal Reserve meetings produce some movement this week.
{quote} Backtest EU 300 trades ;p. Time to build up confidence and familiarize yourself with the TDI cross. Also start drawing S&R lines on your chart and see how they react with price.
Ignored
Yep, I've gone live, trading with microlots. I don't want to demo anymore, it's completely different in terms of decision making, with microlots I won't take too big a risk and I will think twice with each trade.
{quote} When the ADR has been up during the previous week on JPY or AU pairs and there is little pending news, I have found that many times price will trend following market open after the weekend. Nothing more than that.
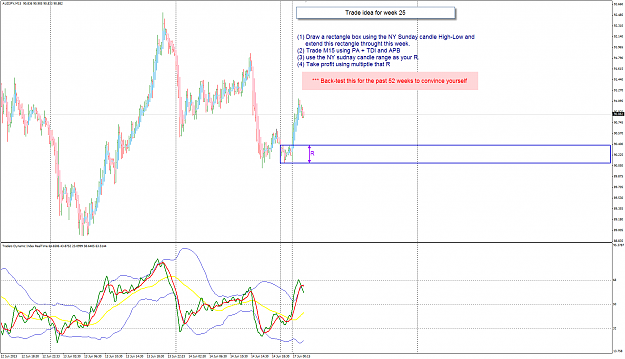
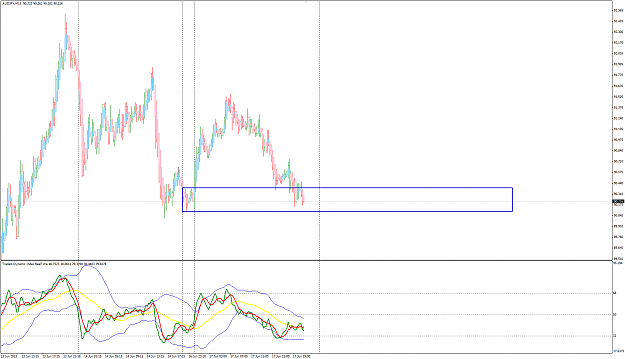
Sunday candle: Here is a trade idea using the Sunday candle with TMS M15: Some traders love NY Sunday candle. Other traders hate this Sunday candle for variety of reasons. You can hide this Sunday candle using different server time and treat the NY Sunday open as a new 24-hour day candle, whatever .... But fact remains that when NY open on Sunday there will be these few hours of trading and you will see these few hours ion lower TF lke H1 and M15. So use this a one way to look for trades duruing the week when you cannot afford the time and sit in...
Ignored
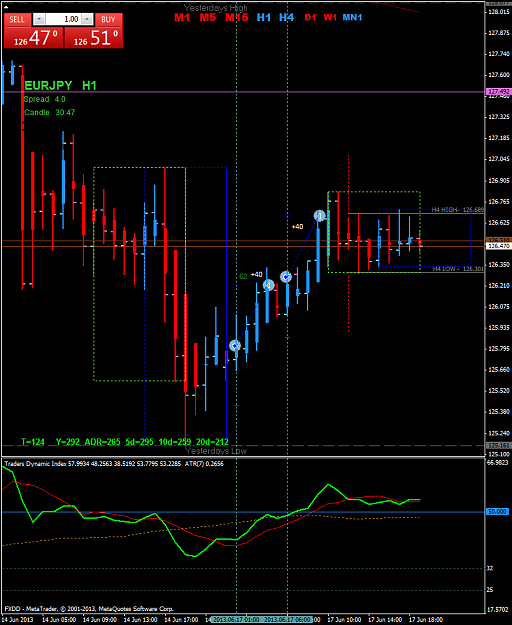
AJ Update Sydney open:
Now you should see that price has returned to this week' open and that Sunday candle range. It is back to the the starting line.
You pick using PA and TDI with the Sunday candle high-low in view.
Good Trading!
Edit: Day Master candle and Inside Bar
Attached Image(s) (click to enlarge)
Honesty is a very expensive gift. You wont find it in cheap people.WBuffett
{quote} Yep, I've gone live, trading with microlots. I don't want to demo anymore, it's completely different in terms of decision making, with microlots I won't take too big a risk and I will think twice with each trade.
Ignored
Dabbeljoe,
You are done with demo and taken the big decision and start Live trading. You aready completed Step 2.
Step 2 is to do back-testing for at least one year old data, then work out a trading plan and start demo. Do 100 demo trades, then another 100 trades and another 100 trades over a longer period of time. With 300 demo trades completed, you will be in a good position to analyse and 'fine tune your trading plan as each of the 100-trades cycles and eventually come up with a final trading plan for Live trading.
Now in Live Trading, you will face the bigger part - Managing the Trader in you, the mental fitness development. But like you said, trading with microlots may not be the most effective way to train ourself in managing our trading psychology. But it serve to test the money management part of your system.
When you need a daily trading coach on the psychological aspects, read this book by Dr Brett Steenbarger.
Good Trading going forward in Live trading.
Regards,
EMMANUEL
Attached Image (click to enlarge)
Honesty is a very expensive gift. You wont find it in cheap people.WBuffett
{quote} Dabbeljoe, You are done with demo and taken the big decision and start Live trading. You aready completed Step 2. Step 2 is to do back-testing for at least one year old data, then work out a trading plan and start demo. Do 100 demo trades, then another 100 trades and another 100 trades over a longer period of time. With 300 demo trades completed, you will be in a good position to analyse and 'fine tune your trading plan as each of the 100-trades cycles and eventually come up with a final trading plan for Live trading. Now in Live Trading,...
"Poor trading practice --- poor execution, risk management and trade management --- is responsible for much emotional distress. Trading affects our psychology as much as psychology affects our trading"
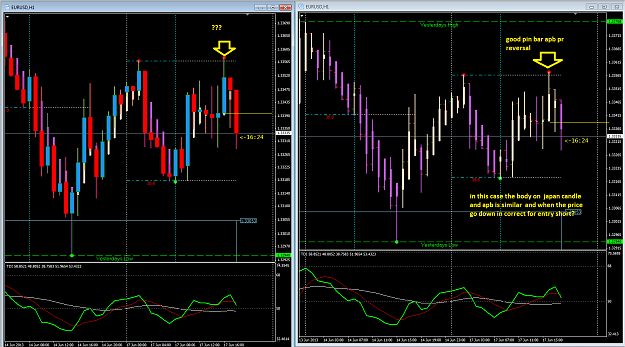
last week - 13 and 14 Jun, - EU lost it up trending momentum. You see this in the D chart candles/ bars OHLC.
This week opening, too early to say if the uptrend continues, by my weekly bias is UP. I will wait for a 4H setup in the direction of my weekly bias.
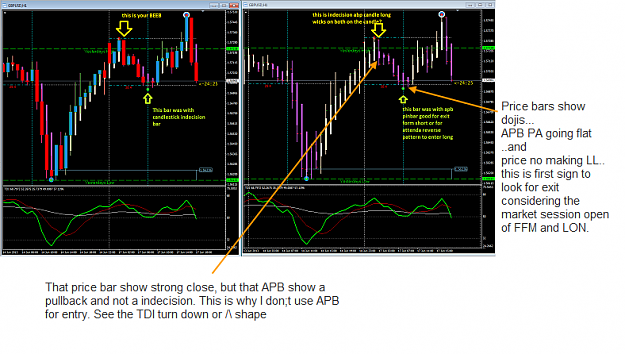
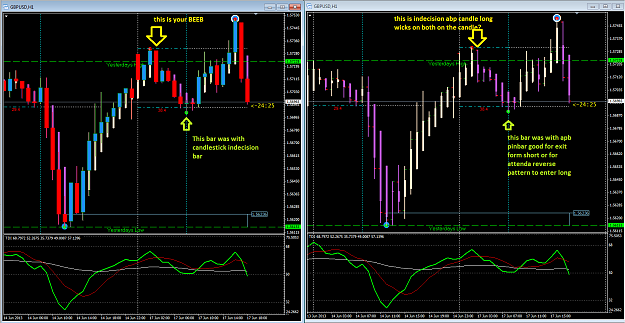
The APB open and close are not real. It can mislead you when you do not pay attention to the real price open and close, which sometimes are hidden by the APB body.
PA using Japanese Candlestick of the price bar is more superior over the use of the APB. This is one reason why I use the real price bar for PA entry and not the APB.
I use the APB for trade management becasue it shows the momentum of price movement when use with the TDI PL and TSL for 4H trading.
Trading the lower Tf like M15 and H1 is quite different as you see some traders are using also the TDI MBL yellow line for trade decisions. But you need to read the market volatility and it is not easy with the TDI VB blue band alone as we need to see what goes on in the chart price data above.
Simple ...YES...the method. But trading it is not EASY.
Honesty is a very expensive gift. You wont find it in cheap people.WBuffett
Japanese candlesticks Doji are indecision candles. Do not mix this with using the APB. If both the realprice bars and APB shows Doji, that is soemthinh ealse when both agrees.
That real price bar BEEB is strong momentum down although the APB show small body, it is because the APB calculate its own body using the previous price data. It is not real.
The later Dojis you marked are real and that is sign when market lost its momentum and not making lower low LL. That considering the market hour - FFM open and LON open, it is about TIMING.
In this case, i was in a H1 trade following that BEEB, I decided to close some positions and keep remaining at the initial SL to fight LO. I loss!
Attached Image (click to enlarge)
Honesty is a very expensive gift. You wont find it in cheap people.WBuffett
{image} I entered this trade, 2 micros, @8am on the 4H. Two TPs, one @.8039 & second @.8013 - both hit while out running errands and added a little over 2% to my demo balance. I like FXDD's times better than Oanda's, my live acct and just may have to switch over. Still demoing for now.
Ignored
piprac,
Good trades. Thanks for sharing them.
Here is how you can show you trades history on your MT4 charts. This way , you exact entries and exist are drawn on your charts and you can save them as part of your trade journal.
Inserted Video
Regards,
EMMANUEL
Honesty is a very expensive gift. You wont find it in cheap people.WBuffett