Hi SKY
ur img is very interesting
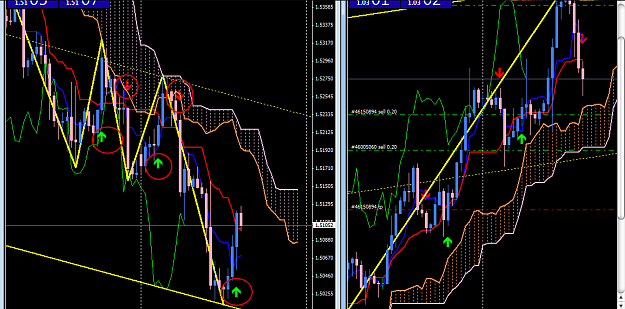
can I ask you how do you get the entry signals showed with those arrows ?? I made circles to understand better the arrows I mean ...
Thanks
I'm not sure it get's much closer than this But I think this one might still be a goner.... {image}
Ignored
We have to wait to see which candle appears after that last doji candle...and price action says wait, do not take any decision now...This kind of chart should not have any affect on trading decision since it indicates nothing (as per price action), we must wait to see 2/3 more candles...
{quote} We have to wait to see which candle appears after that last doji candle...and price action says wait, do not take any decision now...This kind of chart should not have any affect on trading decision since it indicates nothing (as per price action), we must wait to see 2/3 more candles...
Ignored
Of course, I stay in until profit or I am knocked out
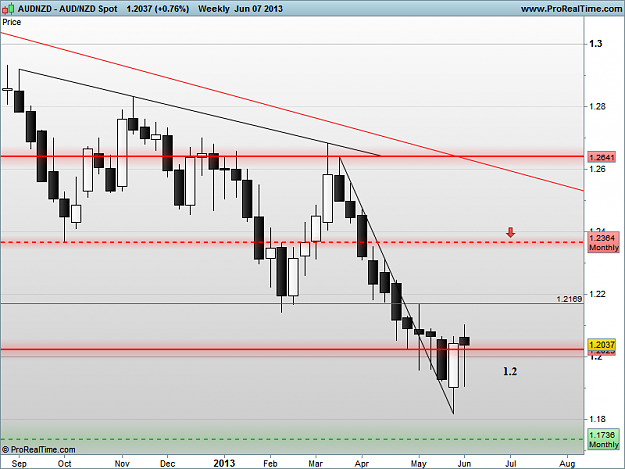
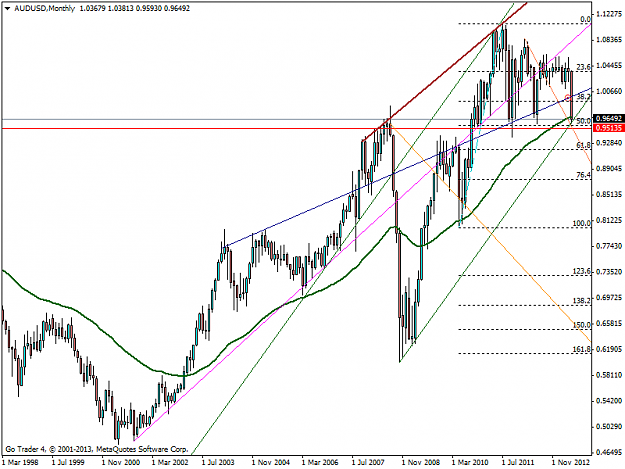
{quote} My "creative" analysis tells me we have finally broken throught the blue off the brown. but we are approaching an interesting area... I've haven't traded the Aussie much before so maybe not much help {image}
Ignored
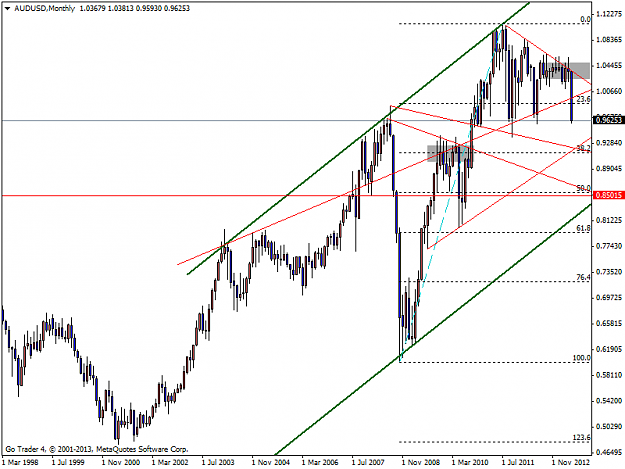
Nice chart of the Aussie.
When I get back to my UFO I will post my Aussie chart .
IMO nothing has changed in the U.S. or Aussie the past weeks , technical trade only.
{quote} Hi SKYur img is very interestingcan I ask you how do you get the entry signals showed with those arrows ?? I made circles to understand better the arrows I mean ... Thanks {image}
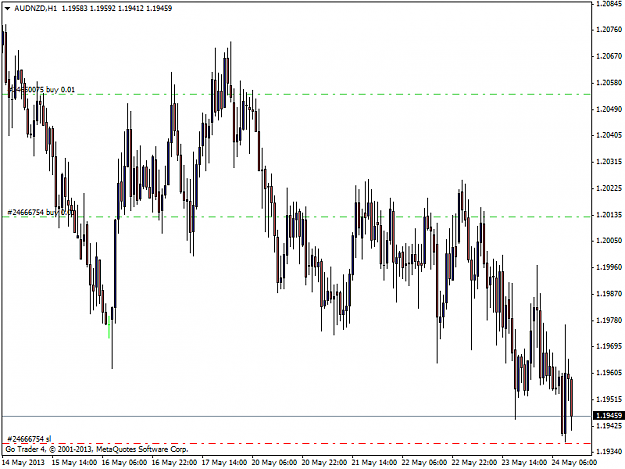
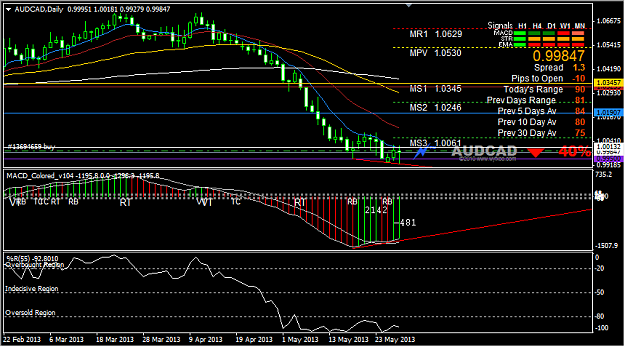
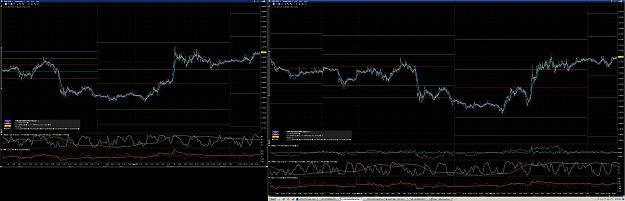
Right so i've been rather unlucky with the AUD trades lately
but im gona recover some.
currently seeing a good opportunity to go long on AUDCAD, with SL if candle closes below 0.9950
MACD divergence occuring, and it usually is a good indication of trend reversal, MACD rolled over top. time for some move up.
Williams%R at the bottom, more space to go up.
probably gona aim for proit at 1.0250
Attached Image (click to enlarge)
We live in a finite world with infinite possibilities.
Hello Traders, well I don't have a complicated system or even crowded charts, but I know a good opportunity when I see one. A rare pair, the USD/ZAR is on the run for greater things to come, having formed a pinbar on the Daily charts at the close of the month. {image} Definitely a good opportunity to sell there
Ignored
I agree with you. Pin bars are my favorite set up signals. I actually took a short trade on this pair based on H4 which has already closed for a R2 (reward risk ratio of 2:1).
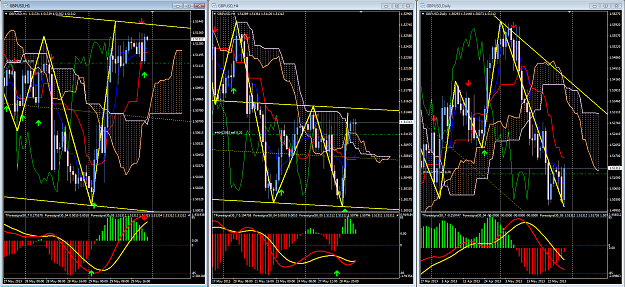
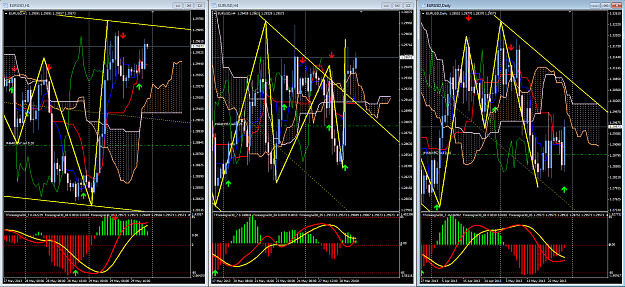
Nice chart, I am using Ichimoku too. Could you be pleased to advise which number you are using for EURUSD and GBPUSD? Are they the same? H1 H4 and D1? I am using 7 22 44 for all time frames.
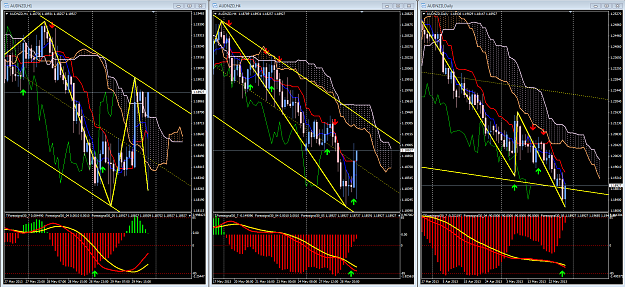
{quote} it sure is.... whereas AUDUSD has been on the easing move... NZDUSD is only beginning it with wheeler suggesting easing in the near future... seems to me the AUDNZD up and down move is a cyclical thing between the AUD and the NZD economy much like the EURO and GBP on EURGBP....
Right so i've been rather unlucky with the AUD trades lately but im gona recover some. currently seeing a good opportunity to go long on AUDCAD, with SL if candle closes below 0.9950 MACD divergence occuring, and it usually is a good indication of trend reversal, MACD rolled over top. time for some move up. Williams%R at the bottom, more space to go up. probably gona aim for proit at 1.0250 {image}
Ignored
How did that work out for you? Bottom picking is too hard, glad I am a TURTLE
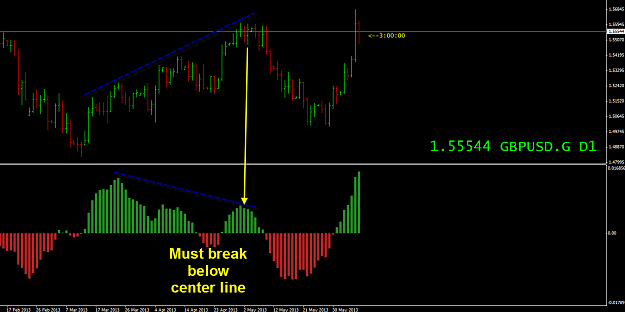
As for the Divergence you mention, I suggest you read a little book by Dr. Alexander Elder called "Two Roads Diverged: Trading Divergences"
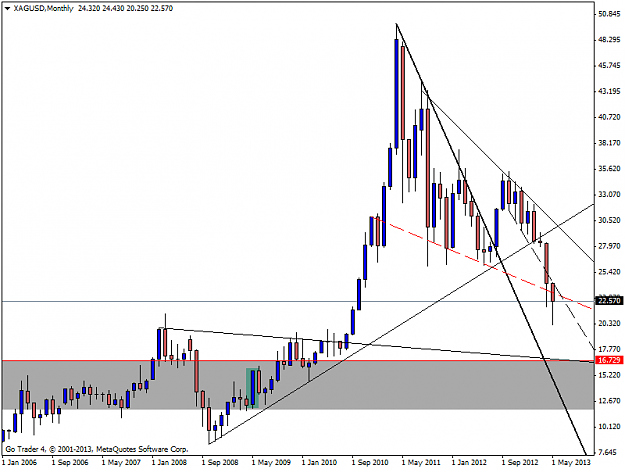
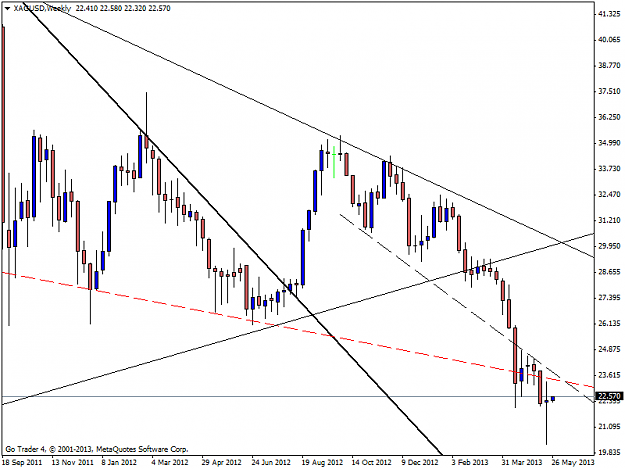
But I can show you what he calls TRUE Divergence with this chart and save you the $7.65 (Kindle Edition)
His main point is that you look to the pattern first, then the price action
What you look for is that the histogram must break the center line
As you see in this example, the rewards are there if & when you spot these at the time
His entry is when there is a lower bar on Histogram (marked) so there are 6 days if you are patient
And there are multiple other entry techniques, Inside Day, Trend Line Break, Horizontal Line Break, Reversal Day
Great thread, always read your comments, regards, E.
Attached Image (click to enlarge)
If you trade like me, you'll be homeless and broke within a week.