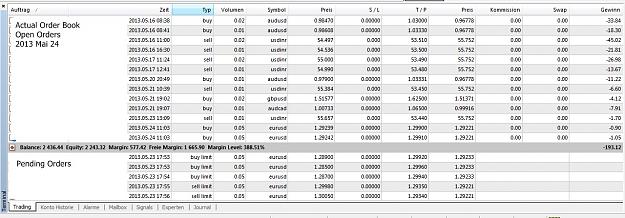
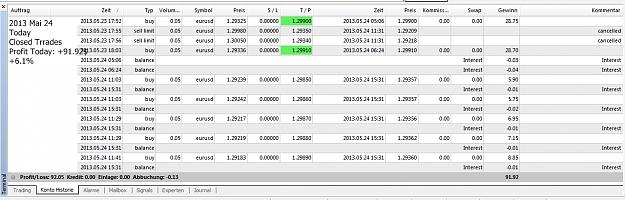
Actul Order Book -672.42$ When I trade my plan it needs more discipline to stay in all my trades nowadays and wait and I'm not willing to delete these loss orders! It seems actually more a question of risk tolerance IMO. I prefere this way of trading. EURUSD, Monthly, 2013 Mai 19 {image} {image}
The last maximum about 2'568.61$ should be recover next week, so I hope I could go on to hit the 3'000.-$ line next month.
If I would reach the 100% Profit Zone in June 2013 maybe I will distribute profits 3'000.-$ > to other accounts till December 2013.
I think about it.
FXcube
Thanks.. Rob.. will read with interest..would be interested to hear your thinking on USD??Best dan.. PS.. who is this Kyle Shortland.. should i watch him..or should i say listen to what come out of his mouth??
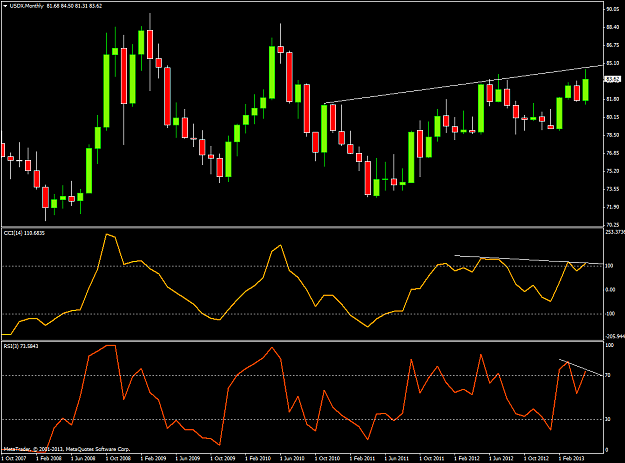
post month chart USDX... similar on week and day..
{quote} Post# 462 Hi roro53!I like your statements so much. What a pity that I haven't continued the Member's Lounge Hodgepodge & Life Trading in the hope to read more of your wonderful ideas & splended comments.FXcube
Ignored
getting back into a flow so i'll be around here too if that is all right with you, Cube.
{quote}Thanks.. Rob.. will read with interest..would be interested to hear your thinking on USD??Best dan.. PS.. who is this Kyle Shortland.. should i watch him..or should i say listen to what come out of his mouth?? post month chart USDX... similar on week and day.. {image}
Ignored
sorry not to have clarified that, danc........there is a link on the link to an article written by Ambrose Evans Pritchard
the focus is a possible attack by hedge funds on the Japanese Gov Bonds
the article by Pritchards also lays out the challenges faced by BOJ in its attempt to double the monetary base and get inflation up to 2% while at the same time keeping JGB bond yields low (the FED and US Treasuries)
the Japanese bond market is second only to the US in size so the risk is that if bond investors fear inflation of 2% then they will not want to hold 10 Year bonds with a yield of less than 1%....
so therefore a possibility of a disorderly unwind of a massive long position in JGB............Pritichards contends, as do others, that the BOJ will have to significantly up the level of intervention or the risk is the BOJ may lose control
in essence it looks like we are talking financial repression here, and the BOJ must crush all resistance.
looking at entry buy orders above 103.75 for uj........also looking to buy lower, but think the volatility in the JGB market may offer some nice lower longs
{quote} Post# 434The last maximum about 2'568.61$ should be recover next week, so I hope I could go on to hit the 3'000.-$ line next month.If I would reach the 100% Profit Zone in June 2013 maybe I will distribute profits 3'000.-$ > to other accounts till December 2013.I think about it.FXcube
to fall to work on a new fancy
Manage a 1'500.-$ Account like a "Forex-Pension-Fund"
Trading Plan!
2013 1'500.-$ > 3'000.-$...(to take one's choice)
2014 3'000.-$ > 6'000.-$...(by one's own choice)
2015 6'000.-$ > 12'000.-$...(to get one's sh*t together)
2016 12'000.-$ > 25'000.-$...(to get one down onesefl)
2017 25'000.-$ > 50'000.-$...(join the club!)
2018 50'000.-$ > 100'000.-$...(one's ears are burning)
2019 100'000.-$ > 200'000.-$...(but they are all rather proud of what they have achieved)
2020 200'000.-$ > 400'000.-$...(to have one over the eight)
2021 400'000.-$ > 800'000.-$...(but in my own way, I am king)
2022 800'000.-$ > 1'600.000.-$...(to have one's bread buttered on both sides) ... 2030 ...(to have one's head in the clouds)
Surpluses will transfered to other accounts and/or should be appropriate for shares & stocks or so.
Allocate profits
Beginning in 2016 new accounts should be created due to security reasons.
Let's see!
FXcube
What Are Retracements? Retracements are temporary price reversals that take place within a larger trend. The key here is that these price reversals are temporary, and do not indicate a change in the larger trend.
Notice that despite the retracements, the long-term trend shown in this chart is still intact - that is, the price of the stock is still going up.
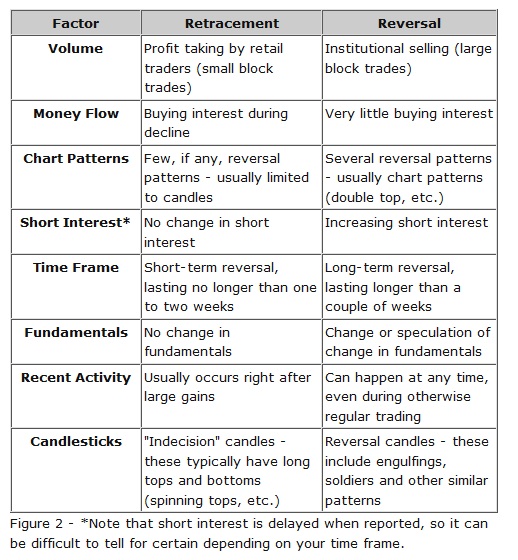
The Importance of Recognizing Retracements It is important to know how to distinguish a retracement from a reversal. There are several key differences between the two that you should take into account when classifying a price movement:
*see below!
Figure 2 - *Note that short interest is delayed when reported, so it can be difficult to tell for certain depending on your time frame.
So, why is recognizing retracements so important? Whenever a price reverses, most traders and investors are faced with a tough decision. They have three options:
1. Hold throughout the sell-off, which could result in large losses if the retracement turns out to be a larger trend reversal.
2. Sell and re-buy if the price recovers, which will definitely result in money wasted on commissions and spreads. This may also result in a missed opportunity if the price recovers sharply.
3. Sell permanently, which could result in a missed opportunity if the price recovers.
By properly identifying the movement as either a retracement or a reversal, you can reduce cost, limit loss and preserve gains.
Determining Scope Once you know how to identify retracements, you can learn how to determine their scope. The following are the most popular tools used to do this:
Fibonacci Retracements Fibonacci retracements are excellent tools for calculating the scope of a retracement. They are most widely used in the foreign exchange market, but are also used in the stock market. To use them, simply use the Fibonacci retracement tool (available in most charting software) to draw a line from the top to the bottom of the latest impulse wave.
Pivot Points Pivot point levels are also commonly used when determining the scope of a retracement. Most traders look at the lower supports (R1, R2 and R3) - if these are broken, then a reversal may be forming.
Trendline Supports Finally, if major trendlines supporting the larger trend are broken on high volume, then a reversal is most likely in effect. Chart patterns and candlesticks are often used in conjunction with these trendlines to confirm reversals.
Dealing with False Signals Even a retracement that meets all the criteria outlined in our table in Figure 2 may turn into a reversal with very little warning. The best way to protect yourself against such a reversal is to use stop-loss points. Here is how you can do this:
1. You can estimate retracement levels using technical analysis and place your stop-loss point just below these levels.
2. Alternatively, you can place the stop-loss just below the long-term support trendline or moving average.
Ideally, what you want to do is lower your risk of exiting during a retracement, while still being able to exit a reversal in a timely manner.
The Bottom Line As a trader, you need to be able to differentiate between retracements and reversals. Without this knowledge, you risk many things such as exiting too soon and missing opportunities, holding onto losing positions and losing money and wasting money on commissions/spreads. By combining technical analysis with some basic identification measures, you can protect yourself from these risks and put your trading capital to better use.
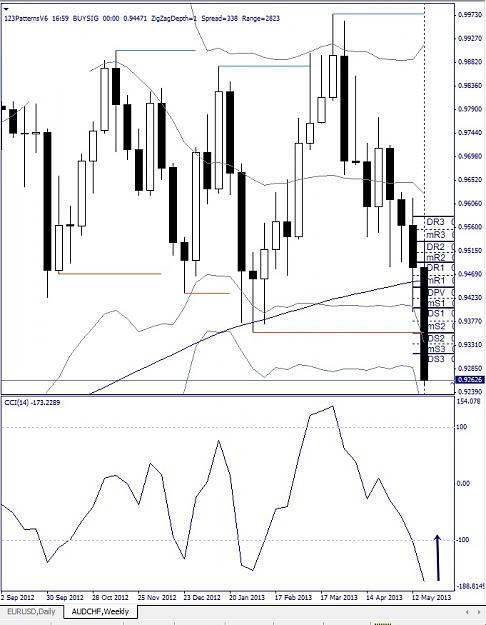
USDX
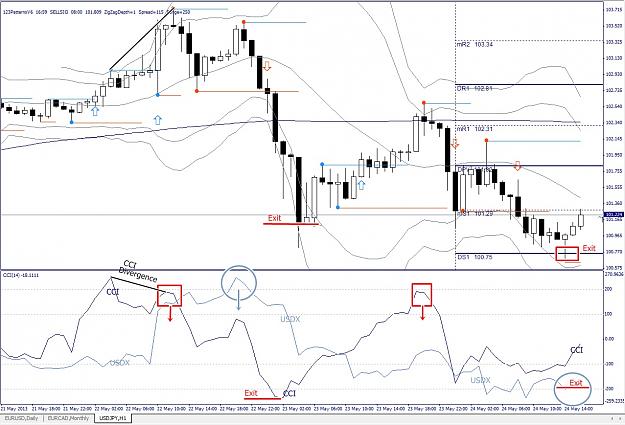
USDJPY, H1, 2013 Mai 25
I trade the CCI additively with the USDX Indicator in the last months sometimes.
Example here: USDJPY, H1
You could compare it with EUR, GBP, CAD, CHF,...and work out the best currency pairs & timeframes.
(See further Post# 501, please).