MTF 100/200 bar MA's Horizontal Lines,
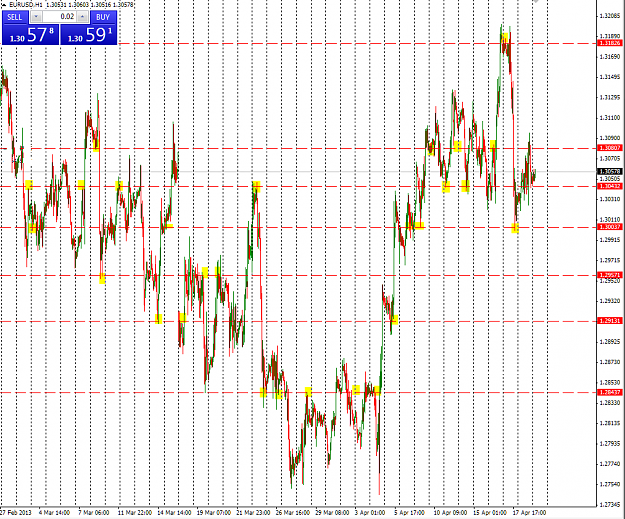
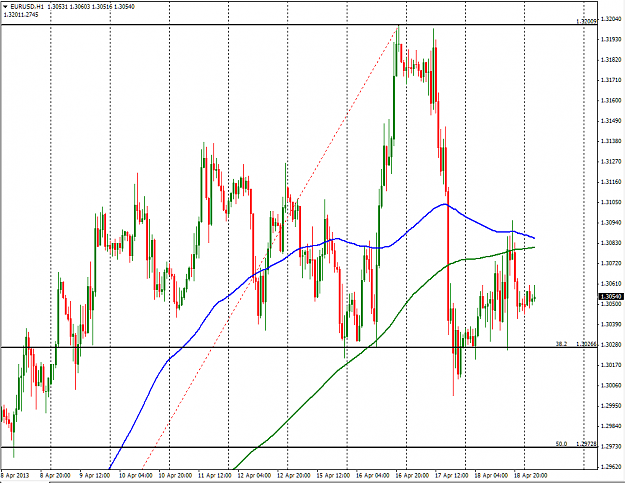
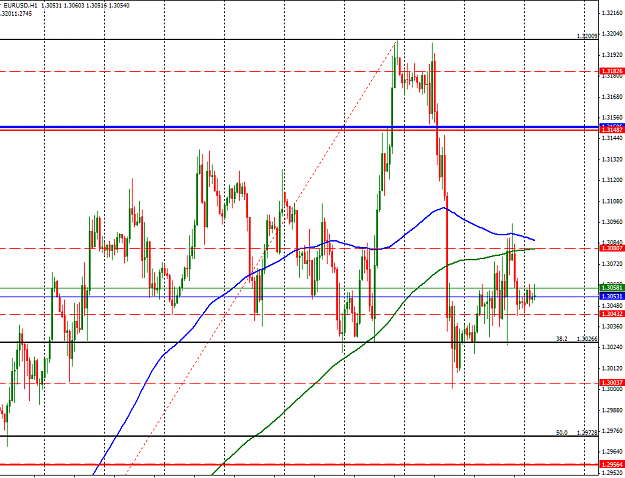
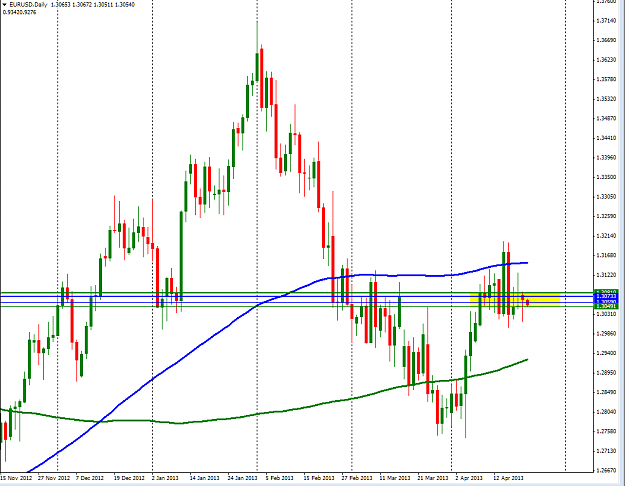
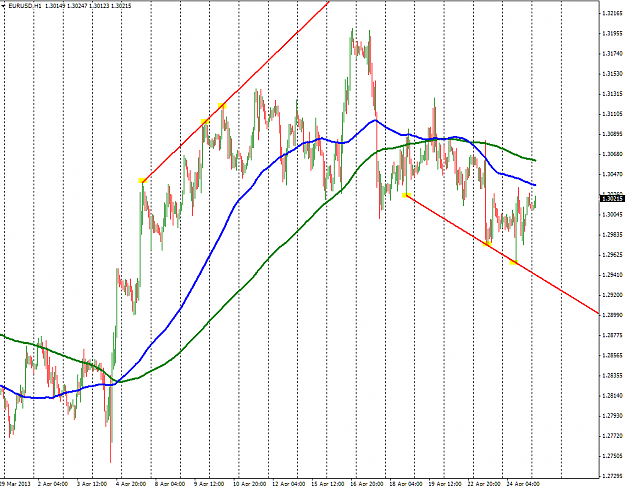
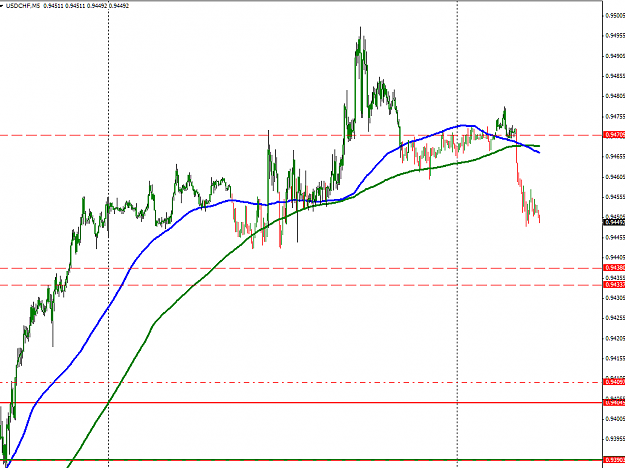
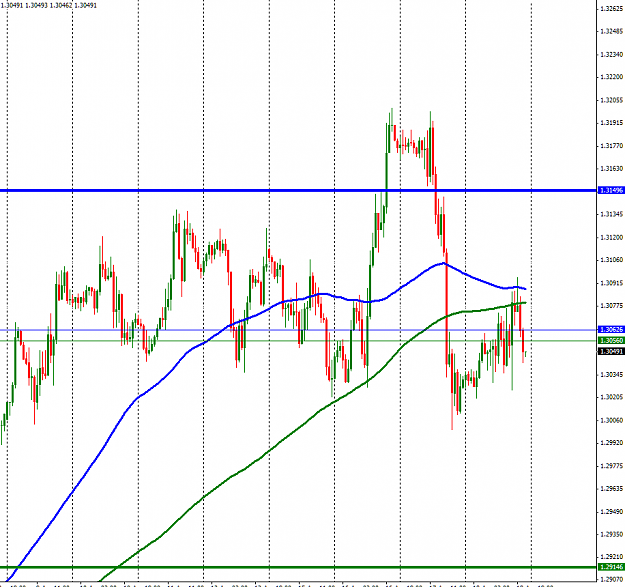
Very good feed back from Gregg michalowski at fxdd . My indicators are simple it shows price of the moving average, The 100 bar daily MA is plotted on the chart with a horizontal line on all time frames. Gregg uses the 100 and 200 bar moving averages on three time frames , 5 minute ,hourly and daily. If you look at the chart and you see the thickest blue line ,that represents the 100 bar MA . Hover mouse over to see !
You can also look at the chart and see the blue line is underneath the green line same thickness with out looking at a diffident time frame you can see if the moving average cross is bullish or bearish . A blue line above the green line is bullish same thinness . The levels act as good support and resistance areas as many institutional traders such as banks use the 100 and 200 bar moving average. Moving averages are just one of the three tools that Gregg uses . The other tools he uses are trend lines /remembered lines and Fibonacci
Attached Image (click to enlarge)
Attached File(s)