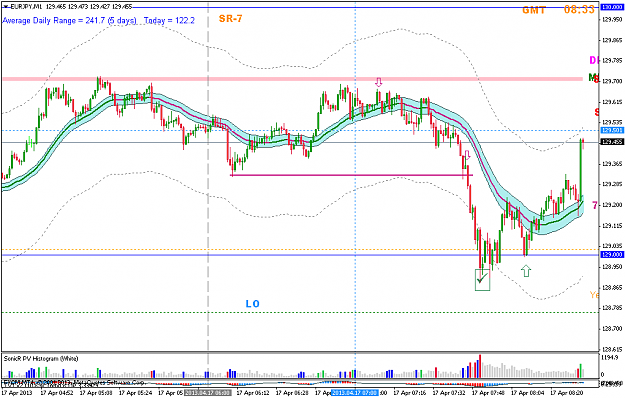
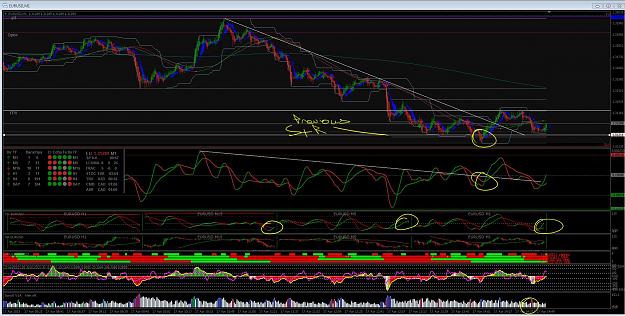
DislikedYes, that's the one that I am talking about and is attached to this chartOn my charts, I like to have S&R levels that have been used in earlier history and back in my old thread, a regular wrote this little indicator that updates any rectangle that you draw - provided you name it SR-1 or 2 or 3 etc - and it changes its colour for support or resistance. Some might find it useful. {image} {file}
Ignored
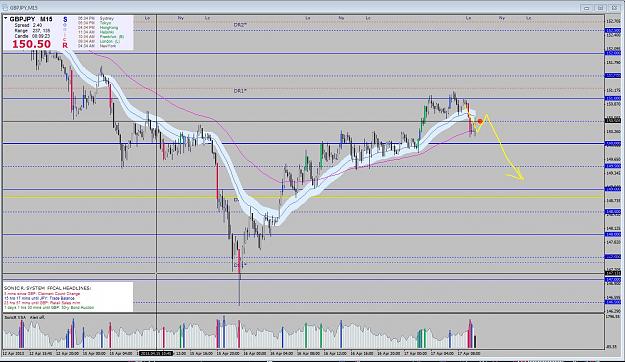
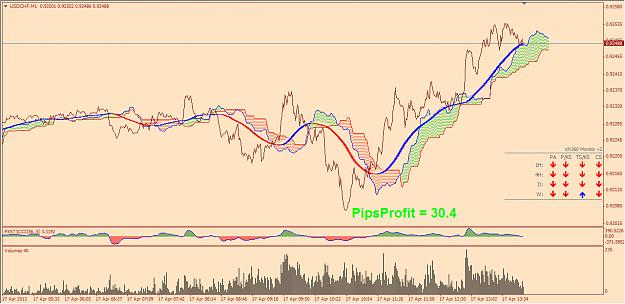
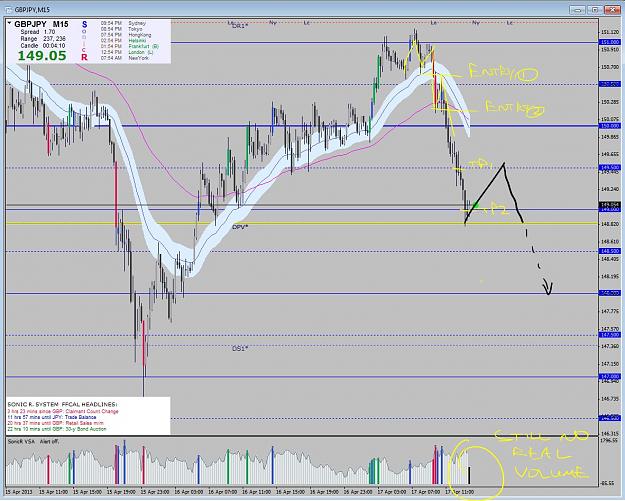
If Sonicers wanting to do Scout trades, the chart example of Islander's Scout trade is an excellent example of a Scout trade if the Down Arrow represents a Short entry.
This is with a lower risk and then it also follows the first ABC-down wave for the Short with a Lower High.